

Gold forecast this week: XAUUSD is trading near 3900 after falling about 3.5% on Friday, and FWE stays bearish while price holds below the 3908-3925 supply area. The first target is Friday’s low near 3870. A 15 minute close above 3925 would weaken that idea.
Gold Today at a Glance
- Gold price: near 3900 as the week opens, after Friday’s fall took gold to its lowest level since October 2025.
- Main news: the Fed held rates last week, but markets still see a December hike as a risk. Oil is easing on Iran talks, and the US midterm elections are on 3 November.
- Key support: 3895, then 3870, then 3800.
- Key resistance: 3908-3925, then 3940.
Gold Forecast This Week: Why FWE Still Leans Bearish
Friday’s break below 4000 kept our bearish view intact. Gold closed the week near 3875 and is bouncing now. So far, we see the bounce as a pause in the decline rather than a reversal. The weekly outlook stays bearish while gold remains well below its 20 day average near 4070.
FWE Gold Chart Analysis: The 15 Minute Supply Zones
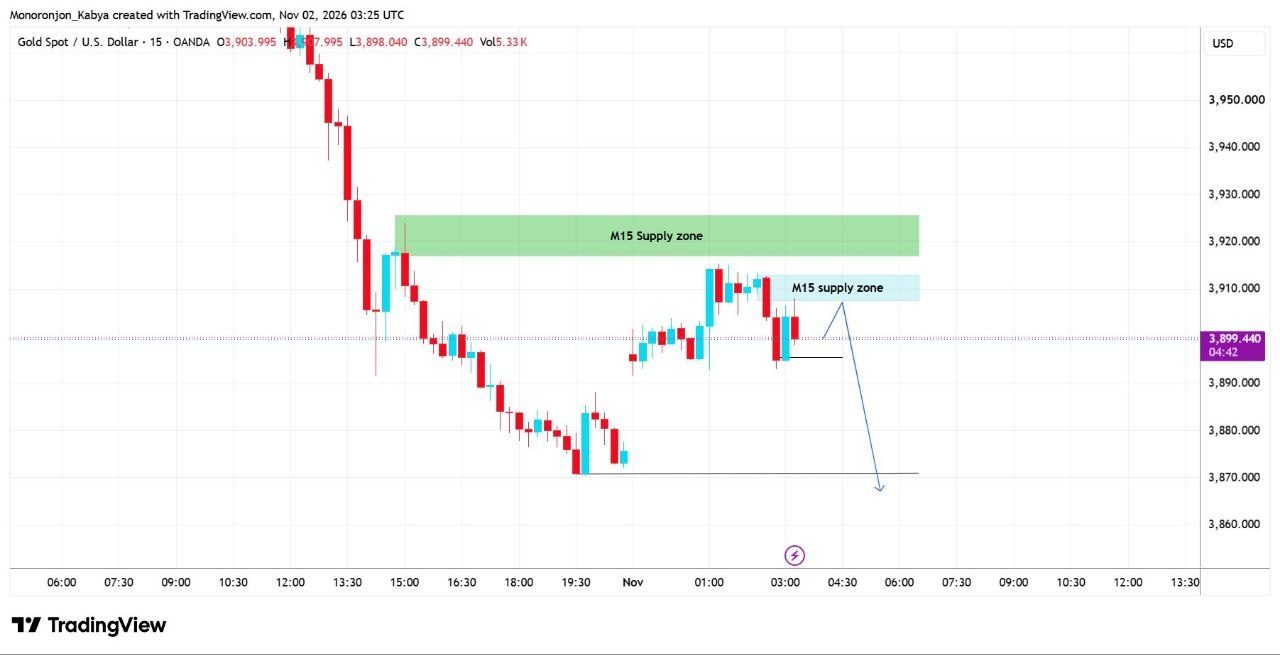
Two supply zones sit above current price, the smaller at roughly 3908-3913 and the larger at 3917-3925. We are watching the lower supply zone for a move back toward 3895, then 3870. For the next day or two, we want to see sellers return at supply before looking for 3870.
The larger zone also sits inside the 3915-3945 daily zone we used as support in our last update. That support failed. We now see that former support as resistance.
The 15 minute setup covers the immediate trade. The daily levels frame the week. We would wait for a 15 minute candle to reject the zone and close back down, with 3895 as the first area to take profit. For example, a sell near 3910 would have a stop above 3925 and a target near 3870. A stop inside the zone leaves little room for a spike. Our lot size guide shows how to size a gold trade so a stop hit stays within your risk limit.
What Changed Since Our 30 October Analysis
In our 30 October analysis, we stayed bearish but also mapped a possible bounce. Both support zones have since failed, and the rebound toward 4075-4095 never developed.
Those old zones now sit above price and are better read as resistance, with 3940 the first area to watch on a stronger rebound.
What Is Driving Gold Today
Friday’s fall came despite a softer dollar and lower Treasury yields. Reports linked the move to forced selling after a drop in tech stocks, and to higher oil prices after attacks on tankers near the Strait of Hormuz, which kept inflation worries alive.
The Fed held rates last week, but markets still see a December hike as a risk. The 28 October decision left the range at 3.75-4.00%, with two officials voting for a hike. CME’s FedWatch tool showed roughly a 73 to 75% chance of a December increase on Monday 2 November, depending on the report. Three Fed officials argued on Friday for more rate increases.
Lower oil prices are offering gold some relief today. Oil slipped as Iranian and Qatari officials held a third day of talks aimed at ending the war, although tanker attacks keep risk premiums high. One analyst warned that Iran rhetoric could rise again after the midterms. We would treat the bounce as fragile until gold closes back above 3940.
Gold Weekly Outlook: Scenarios and Invalidation
Base case, bearish. Gold rejects the 3908-3925 area, breaks the minor low near 3895 and tests 3870. A daily close below 3870 would open the way toward 3800. Our gold forecast this week is wrong in the short term if a 15 minute candle closes above 3925.
Relief rally. If oil keeps falling and Fed hike bets cool, gold can squeeze up to 3940 and even toward 4000. We would still treat that as a chance to sell until a daily close above 3940, and the bigger bearish picture only weakens above roughly 4070.
After Friday’s sharp fall, we would keep size small and avoid chasing the bounce.
Gold Support and Resistance Today
| Level | Price | Source | Why it matters |
|---|---|---|---|
| 20 day average | about 4070 | Market data | A daily close above it is needed to ease the bigger bearish bias |
| Old daily zone | 3940-3945 | FWE earlier note, market data | Former support, now first resistance on a stronger bounce |
| Upper supply zone | 3917-3925 | FWE chart | A 15 minute close above 3925 cancels the intraday sell idea |
| Lower supply zone | 3908-3913 | FWE chart | First place we expect sellers to return |
| Minor low | 3895 | FWE chart | First level sellers need to break |
| Friday low | 3870 | FWE chart, market data | First target. A daily close below it opens 3800 |
| Next support | 3800 | Market data | Round number and next area of interest below |
Gold COT Report: Positioning Before Friday’s Fall
The latest CFTC report shows funds were still heavily net long before Friday’s fall. The positions below are as of Tuesday 27 October. Managed Money (hedge funds and trend following funds) added a little to its longs that week.
| Group | Long | Short | Net | Weekly net change |
|---|---|---|---|---|
| Managed Money | 122,508 | 16,946 | +105,562 | +1,356 |
| Producers / Merchants | 20,487 | 30,061 | -9,574 | +5,209 |
| Swap Dealers | 20,230 | 226,280 | -206,050 | +14,749 |
| Other Reportables | 101,216 | 20,327 | +80,889 | -14,770 |
| Small traders | 48,622 | 19,449 | +29,173 | -6,544 |
Open interest was 396,810 contracts, down 5,469 on the week. Other Reportables cut their net long by 14,770, so some money was already leaving. Swap dealers, mostly banks, hold the large short on the other side.
Managed Money remained heavily net long before Friday’s fall. That long exposure adds to our caution about buying the dip. These figures predate Friday’s fall, so they cannot tell us how funds are positioned now.
Central Bank Buying and Gold ETF Flows
The World Gold Council’s latest central bank figures are for August 2026, when reported net buying was 39 tonnes, bringing purchases from January to August to 170 tonnes. For September 2026, global gold ETFs took in about 10 billion US dollars, and third quarter inflows reached a record 31 billion. ETF holdings stood at a record 4,256 tonnes.
That buying has not stopped the slide. Gold now sits roughly 30% below its January record, according to market reports. Large ETF holdings also mean there is still gold that could be sold if sentiment keeps turning.
What to Watch Next
- US midterm elections on 3 November. Watch for volatility as results come in.
- US jobs report later this week. Strong numbers could add to December hike bets and weigh on gold. Check the exact release time in your economic calendar.
- Oil and Iran headlines. Watch for changes in inflation expectations.
- The 3870 low. A daily close below it shifts the talk to 3800. A hold with a strong reaction would point to a larger bounce.
If you trade a prop firm account, check your firm’s rules before holding trades through the election and the jobs report. Our guide to prop firm news trading rules explains how traders breach accounts on news days. For gold news and updated levels, follow our Telegram channel.
Free Forex Signals App: Forex Signals by FWE
Get free gold signals, free XAUUSD signals and free forex signals on your phone. Every new gold buy sell signal arrives as a notification, with entry, stop loss and take profit, plus our daily gold updates.
Android: Download on Google Play | iPhone: Get the app for iPhone
This analysis is an opinion about probabilities, not financial advice or a trade signal. Gold is volatile, especially around news, and trading carries a real risk of loss. Never risk more than you can afford to lose.
Editorial Note: The charts and technical analysis in this post are prepared by the ForexWaveExpert (FWE) trading team. Every post is reviewed, fact-checked and corrected by Rana Das, Founder & CEO of ForexWaveExpert, a gold trader with 15+ years of experience in Elliott Wave and Price Action and winner of the Fastbull Best Mentor Award 2024. This analysis is for educational purposes only and is not financial advice.