

Gold analysis today: XAUUSD is trading near 3905, below Monday’s close near 3945. We’re bearish below 3925-3930, with buyers facing their first test at 3885-3893. A 15 minute close above 3965 would cancel that view.
Gold Today at a Glance
- Gold price today: near 3905, below Monday’s close near 3945.
- Main news: oil fell sharply on Monday, December Fed hike bets remain high, and US voters head to the polls today.
- FWE bias for today: bearish below 3925-3930.
- Key support: 3885-3893, then 3870, then 3840.
- Key resistance: 3925-3930, then 3965-3970.
Gold Technical Analysis Today
Monday’s rebound ran out of steam. Gold spiked to about 3970 when oil collapsed, printed a lower high near 3963 early today, and has since slipped back to 3905 in small steps. That looks like a failed bounce, not the start of a new uptrend.
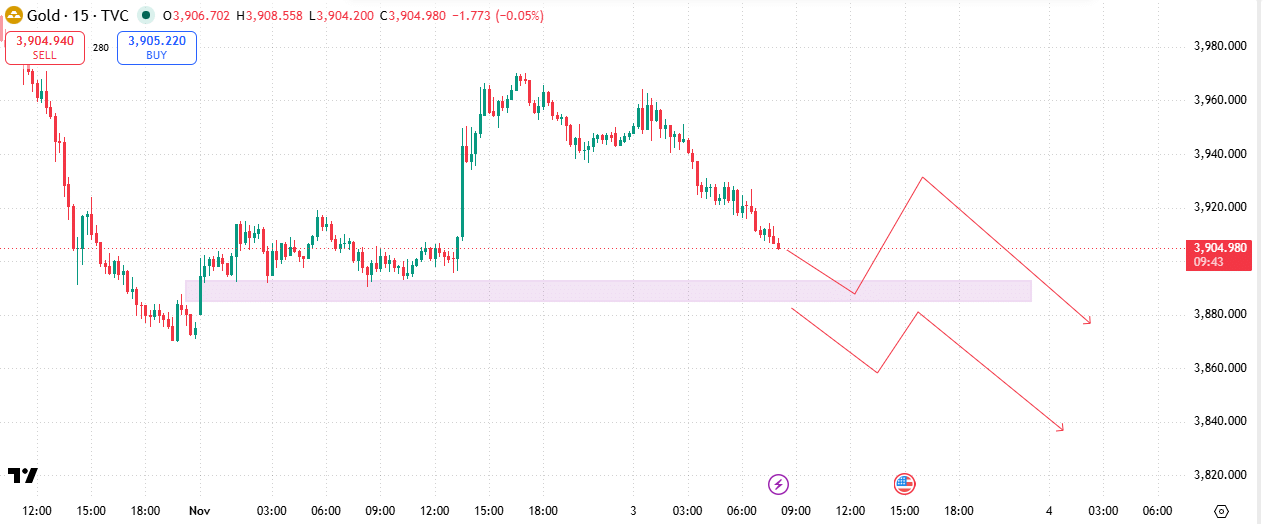
We’re watching 3885-3893 for a possible bounce. Monday’s breakout started from there, so buyers have a reason to defend it. These are possible routes lower, not precise price forecasts.
- If buyers defend the zone, we could get a bounce toward 3930 before sellers return, with 3875 near Friday’s 3870 low as the next downside area.
- A clean break could take gold toward 3860. A brief recovery toward 3880 may follow before another push toward 3840.
Selling this close to support risks chasing the move. A cleaner plan is to wait for a bounce into 3925-3930 and a rejection there, or for a 15 minute close below 3885. Keep size small, because spreads and slippage grow around US news. Our lot size guide shows how to keep a stopped trade inside your risk limit.
Today we’re trading the price action rather than an Elliott Wave count. Bulls first need to clear the lower high near 3963. The bigger bearish picture only weakens on a daily close above the 20 day average near 4065.
| Level | Price | Why it matters |
|---|---|---|
| 20 day average | about 4065 | A daily close above it is needed to ease the bigger bearish bias |
| Monday high and lower high | 3963-3970 | A 15 minute close above 3965 cancels today’s sell idea |
| Bounce area and old supply | 3925-3930 | First place sellers should return on a bounce |
| Minor low | about 3905 | Current price area, first support gold is leaning on |
| Support zone | 3885-3893 | Where buyers defended Monday, the key test today |
| Friday low | 3870 | A break opens 3840 and the deeper targets |
| Possible downside target | about 3840 | End of the deeper bearish route |
| Next support | 3800-3817 | Round number and the next area below |
Gold Fundamental Analysis Today
Oil is the main swing factor right now. On Monday crude fell more than 7% on hopes of a diplomatic end to the US and Iran conflict, with WTI settling near 96 and Brent near 105. Lower oil eased inflation worries and gave gold some relief after the weakest October since 2008. Even so, gold sits about 30% below the January record near 5589.
The Fed is what weighs on gold most. It held rates at 3.75-4.00% last week. Monday’s FedWatch readings put the chance of a December hike at roughly 70% to 75%, down from about 80% a week earlier. Traders still see a hike as the likelier outcome, and last week’s growth and inflation figures have kept those hike bets high.
On Monday, the dollar index traded near 102 and the 10 year Treasury yield fell about 6 basis points to 4.87%. In our view, a yield near 4.9% makes a big gold rally hard. Monday’s ISM manufacturing report also showed faster growth in October, with price pressures easing but still high.
Today’s US midterm elections bring event risk, together with factory orders, JOLTS job openings and several Fed speakers. Nonfarm payrolls and ISM services follow later this week. How gold reacts to the election result is uncertain, and spreads can widen fast. If you trade a prop firm challenge, read the prop firm news trading rules before you hold a trade through the data.
Yesterday’s Gold Summary (Monday 02 November)
- What we expected: sellers returning at the 3908-3925 supply zone, with 3895 and then 3870 as targets. A 15 minute close above 3925 was our invalidation. Details are in our previous gold forecast.
- What happened: gold chopped between about 3895 and 3918 early on, then broke 3925 and 3940 on the oil drop and reached roughly 3970. The intraday sell idea failed.
- Levels: the 3870 Friday low held, with Monday’s low near 3880. Gold finished Monday just above 3940 after a strong rebound.
- Since then: price has handed back some of the gain and sits below the old supply again. Today’s bearish view depends on sellers holding 3925-3930.
Gold Analysis Today: What to Watch Next
- Whether gold holds 3885-3893 on the first test, or closes below it on the 15 minute chart.
- Any bounce toward 3925-3930, and whether sellers reject it.
- Oil headlines on US and Iran diplomacy, which moved gold on Monday.
- Fed speakers and the payrolls report, which can shift December hike odds again.
Frequently Asked Questions
Should I buy or sell gold today?
We favour selling a rejected bounce rather than chasing gold into support. A 15 minute close above 3965 would cancel today’s bearish view. This is an opinion about probabilities, not a signal, so size your risk before you enter.
Why does falling oil help gold?
Lower oil eases inflation worries. That reduces pressure on the Fed to raise rates, and gold becomes more attractive when rate hike expectations fade. The link is not guaranteed, because yields and the dollar can overrule it.
Why did gold fall in October?
Gold fell sharply in October as markets priced more Fed rate hikes after strong US growth and inflation data. Oil stayed high for much of the month, which kept inflation worries alive. It was gold’s weakest October since 2008.
How should I trade gold on US election day?
Expect wider spreads and sudden spikes. Cut your lot size, keep a stop loss on every trade, and check your prop firm’s news rules if you trade a challenge. Skipping the first minutes after a big headline is often the safer choice.
We post daily gold updates and level changes on the FWE Telegram channel.
Free Forex Signals App: Forex Signals by FWE
Get free gold signals, free XAUUSD signals and free forex signals on your phone. Every new gold buy sell signal arrives as a notification, with entry, stop loss and take profit, plus our daily gold updates.
Android: Download on Google Play | iPhone: Get the app for iPhone
Trading gold and CFDs carries a high risk of loss. This is an opinion about probabilities, not a signal or financial advice. Levels can fail, and news can move gold past any stop. Never risk more than you can afford to lose.
Editorial Note: The charts and technical analysis in this post are prepared by the ForexWaveExpert (FWE) trading team. Every post is reviewed, fact-checked and corrected by Rana Das, Founder & CEO of ForexWaveExpert, a gold trader with 15+ years of experience in Elliott Wave and Price Action and winner of the Fastbull Best Mentor Award 2024. This analysis is for educational purposes only and is not financial advice.