
This is the archived FWE gold analysis from 12 November 2026. The latest update is always on Gold Analysis Today.
Last updated: 12 November 2026, 12:23 PM (Bangladesh time, GMT+6)
Gold analysis today comes down to one area: roughly 3960-3900. Gold is trading near 3980 after two weak sessions that followed hot US inflation data. FWE expects rallies to stay capped below 4074-4082. Dips into the demand area have a fair chance of finding buyers, as long as 3870 holds.
Gold Today at a Glance
- Gold price today: around 3980, after Wednesday’s loss of about 1%.
- Main news: hotter US inflation lifted December Fed rate hike odds to roughly 88%. That supports the dollar and yields.
- FWE bias: cautious. Sellers lead below 4074-4082, but the FWE chart looks for a bounce attempt from demand at about 3960-3900.
- Key support: 3961, then about 3920-3950 and 3895-3912. Major support 3866-3879.
- Key resistance: 4020, then 4074-4082 and 4134-4149.
Gold Technical Analysis Today
Gold analysis today: the FWE chart view
On the FWE 4 hour chart we expect a dip first, then a bounce. Support sits at 3961, with two demand blocks under it at about 3920-3950 and 3895-3912. Our path has price testing the first block, maybe pushing into the second, and then rallying toward roughly 4170-4210. The invalidation level is 3870, the October 30 low. A 4 hour close below it cancels the bounce idea.
The demand block ranges and the upper projection were read from the chart’s price axis, so treat them as approximate zones, not exact prices. The 3961 and 3870 levels are the firm reference points.
The upper demand block matters because price based there before the sharp jump in early November. Buyers often defend a base that launched a rally, at least once. Often is not always, so the invalidation sits below both blocks.
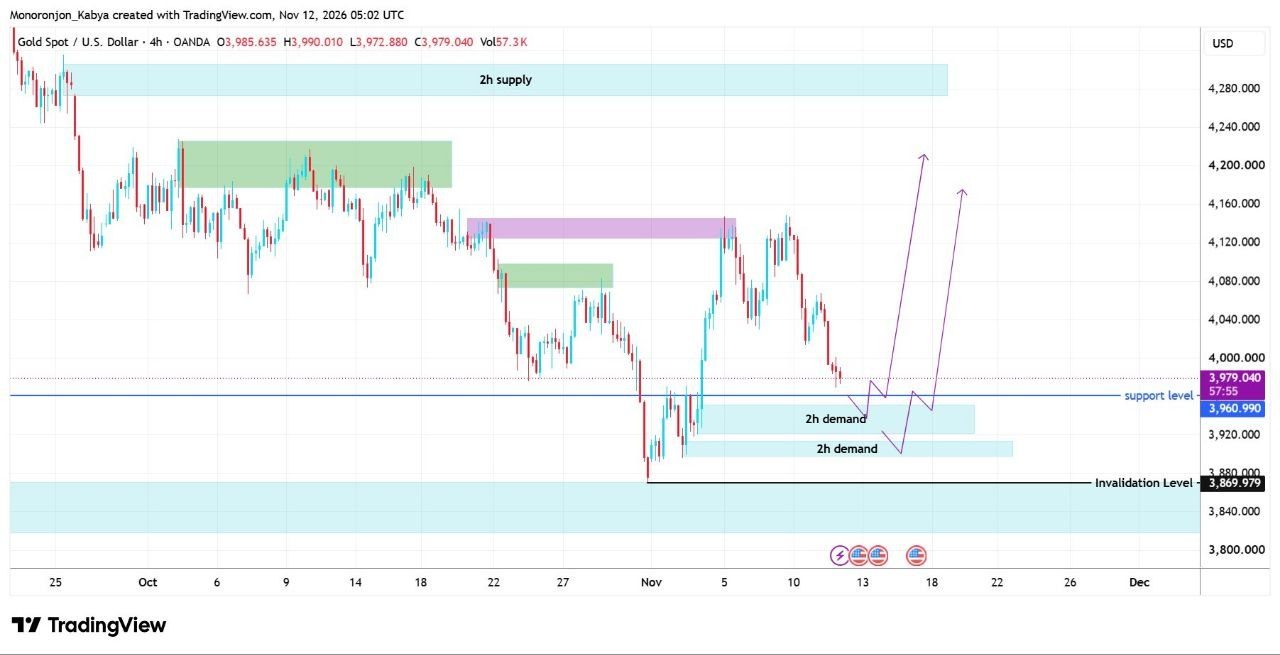
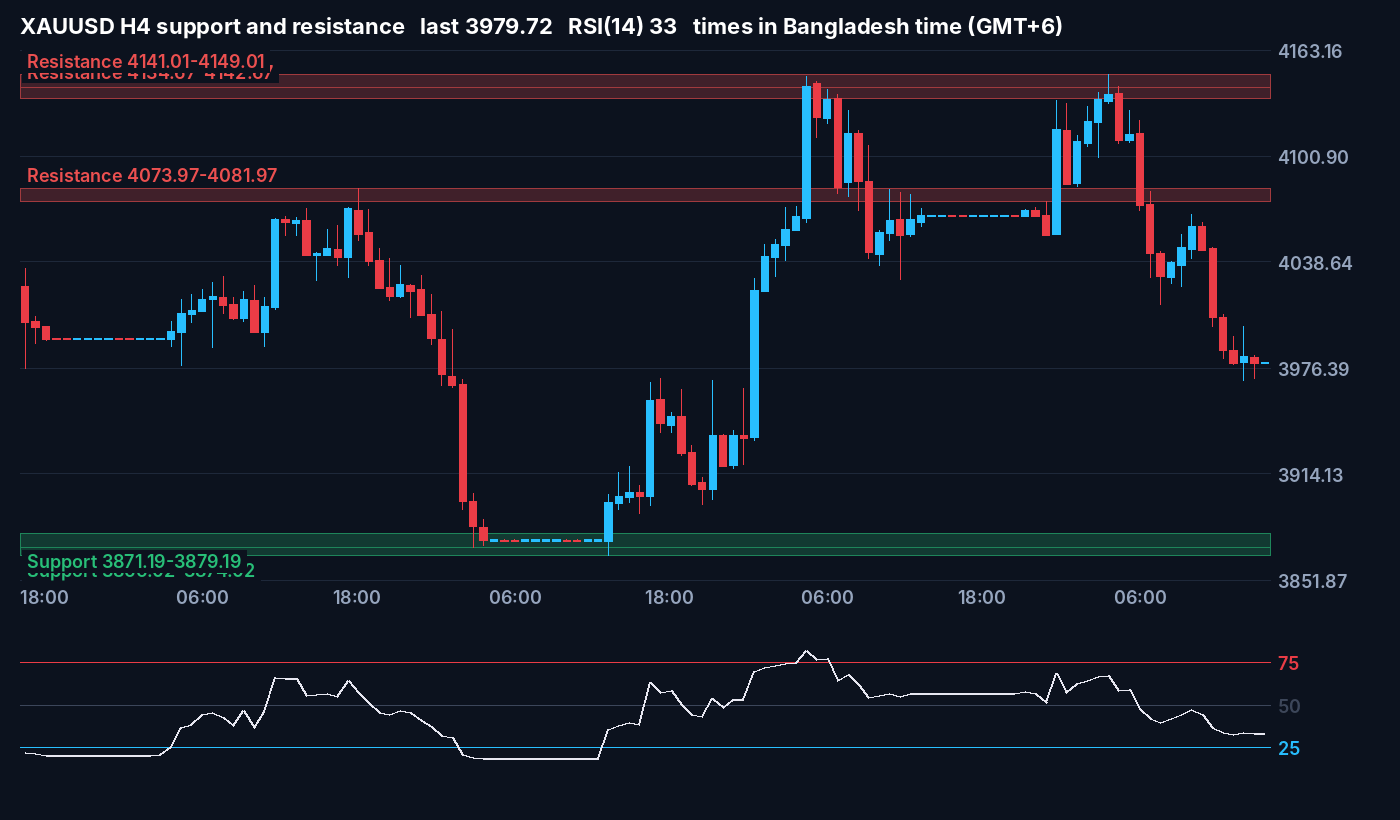
H4 chart: lower highs, slowing candles
Gold failed twice to hold above 4134-4149, and both times the rejection was quick. After the second one, price stepped down through 4074-4082, which used to act as support. The latest H4 candles are small and bunched near 3980, with RSI around 33. Selling is slowing down. That is not the same as buyers showing up.
H1 chart: wicks near 3970
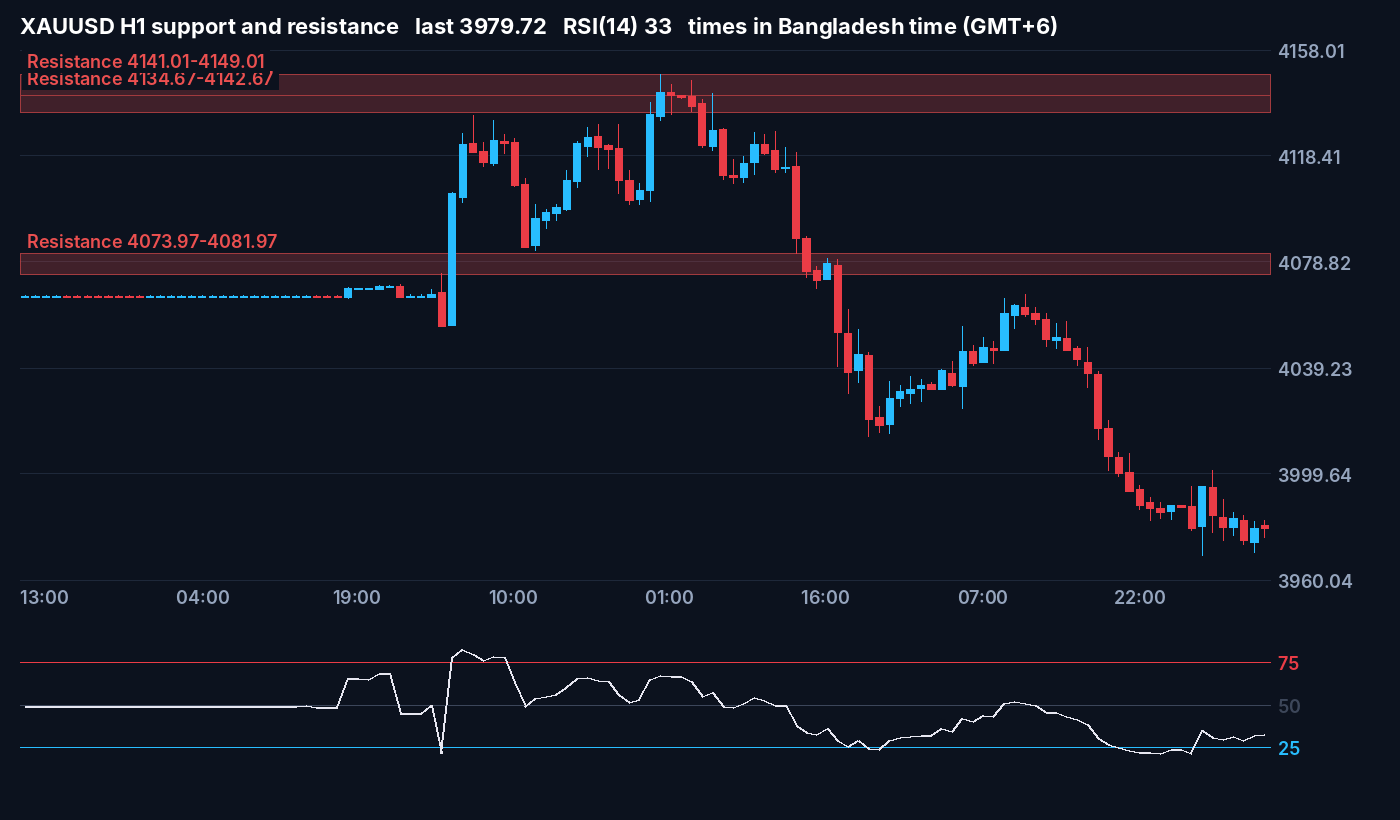
The H1 chart shows how fast the damage came. The drop from the 4140s broke 4074-4082, a bounce died under 4070, and price then slid through 4000. In the last few hours a rebound candle with a long lower wick formed near 3970. Sellers have not pushed below that level yet. One wick is not a reversal.
Elliott Wave and price action
There is no wave count on today’s charts. Yesterday’s short term count was dropped once price lost 4020, and we are not going to force a new one. Until a clean three wave bounce or a finished five wave decline shows up, supply and demand levels are the more honest tool.
Additional market context
Gold still trades well below its 200 day average, and October ended with a loss of nearly 7%. In our own read, 4020 is the first level that matters for any bounce. A recovery that cannot clear it is only a pause. The FWE projection toward roughly 4170-4210 needs gold to get through 4074-4082 and 4134-4149 first, and both zones rejected price in the past week. Treat the upper targets as a stretch, not the base case.
Gold forecast today: scenarios
- Bounce case: 3960-3900 holds and an H1 candle closes above 4020. The next test is 4074-4082, where sellers may return.
- Selling case: an H1 close below 3960 tells us the first demand block is not holding. Then 3895-3912 and 3866-3879 come into view.
- Bounce idea invalid: a 4 hour close below 3870. The next areas are around 3820, then 3800.
- Bearish view weakens: an H4 close above 4082. A sustained move above 4149 cancels it.
These are probabilities, not signals. If you trade these zones, size the position from your stop distance with the lot size guide, and place the stop using the gold stop loss methods.
Gold support and resistance today
| Level | Price | Source | Why it matters |
|---|---|---|---|
| Major resistance | 4134-4149 | FWE H4 and H1 chart | Two rejections in the past week. A sustained break above cancels the bearish view. |
| Resistance | 4074-4082 | FWE H4 and H1 chart | Former support. First big test for any bounce. |
| Recovery trigger | 4020 | FWE H1 swing level | First sign that buyers are gaining control. |
| Support line | 3961 | FWE 4 hour chart | Close below it on H1 weakens the bounce case. |
| Demand block 1 | About 3920-3950 | FWE 4 hour chart (approximate) | Base of the early November rally. |
| Demand block 2 | About 3895-3912 | FWE 4 hour chart (approximate) | Second chance for buyers if block 1 fails. |
| Major support | 3866-3879 | FWE H4 chart | Area of the October 30 low. The 3870 invalidation sits here. |
Gold Fundamental Analysis Today
Gold news today is still about interest rates. Tuesday’s October US inflation report came in hotter than expected, with headline prices up 0.4% against a 0.3% forecast and core up 0.3% against 0.2%. That core reading is the level Fed Governor Waller had named beforehand as a reason to consider a half point hike. CME FedWatch now shows roughly an 88% chance of a quarter point hike in December and about 12% for a half point move. A hold is no longer priced in, and some traders expect three more quarter point hikes by mid 2027.
Friday’s jobs report added to the pressure. Payrolls rose by 165,000 against about 65,000 expected, and unemployment fell to 4.1%. The dollar is near its highest level since April 2025. The 10 year Treasury yield closed Tuesday at about 5% and was quoted near 4.99% on 12 November. Those readings are confirmed. How far they push gold is our interpretation, but this week’s pattern is plain: hawkish data pushed gold down, and last week’s bounce came on a softer dollar and lower yields after the US midterm elections.
Lower oil prices and US and Iran diplomacy have not helped gold, because rate expectations are doing most of the work. The next Fed decision is on December 9. Our guide to trading gold during FOMC covers how to prepare.
What to Watch Next
- Today: US jobless claims at 13:30 GMT, forecast near 195K against 189K last week. Six Fed speakers follow.
- Friday: US producer prices for October, forecast up 0.4%. Another hot inflation number would add to hike bets. Prop firm traders should read the news trading rules before holding trades through it.
- Levels: an H1 close below 3960 or above 4020, and a 4 hour close below 3870.
For this gold outlook this week and quick level updates during the day, follow the FWE Telegram channel.
Yesterday’s Gold Analysis: What Changed? (Wednesday 11 November)
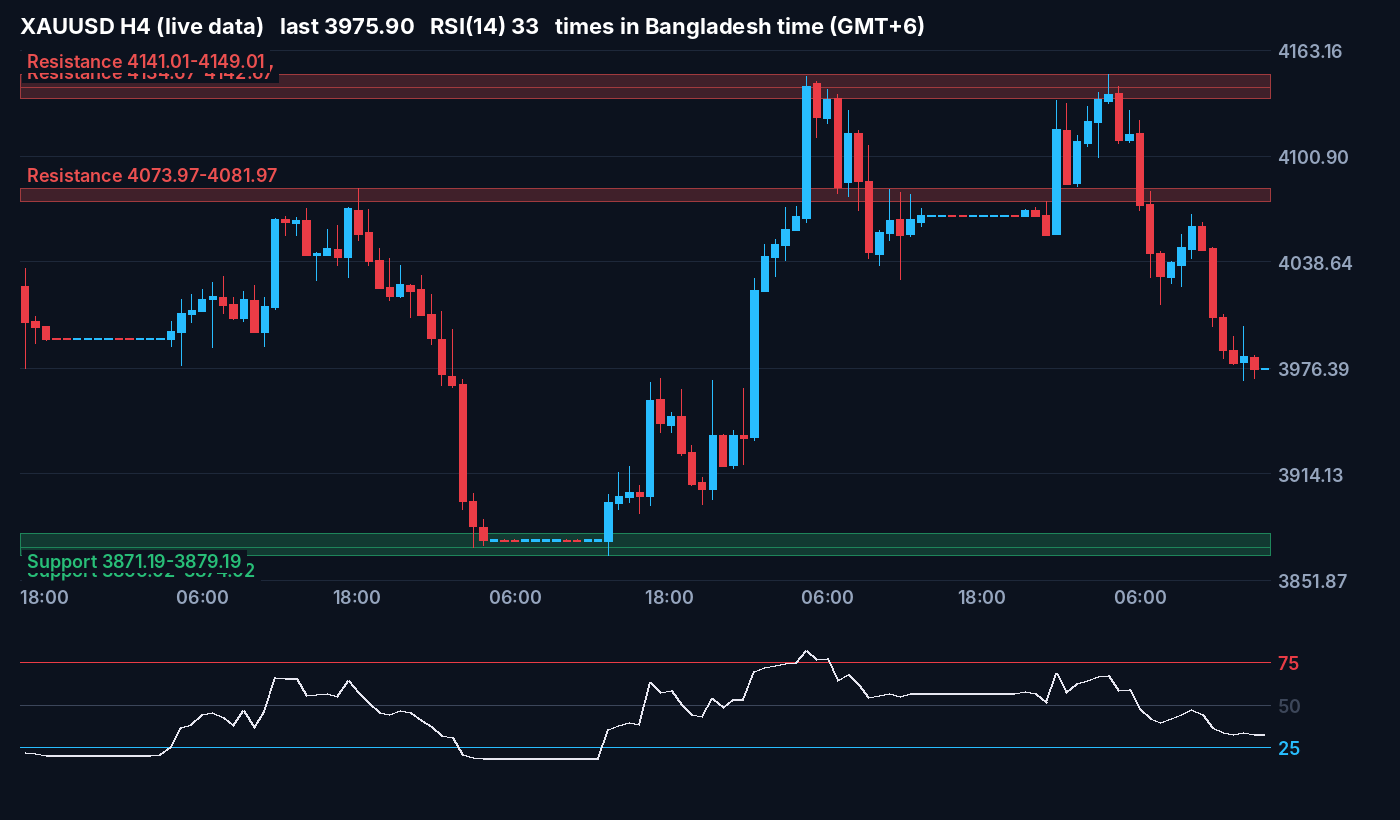
- The call then: bearish below 4074-4082, with 3976-3986 as the support to watch and an H1 close above 4020 as the first sign of recovery.
- What happened: gold never reclaimed 4020 and is still pinned near 3980, so the bearish call stands.
- Levels: the 3976-3986 area has held so far, with lows near 3970. The 3961 level has not been reached on the H1 chart.
- Result: not a win or a miss yet. Nothing has been proven either way.
- What changed today: the FWE chart adds the two demand blocks and the 3870 invalidation. Yesterday’s 3930 reference sits inside the first block, so we now watch for a bounce attempt there instead of only more downside.
Gold Analysis Today FAQ
How often is this gold analysis today updated?
Every trading day, Monday to Friday. The page keeps the same address and each update replaces the previous one, with a short summary of what gold did since the last update.
What does the daily XAUUSD analysis include?
Gold technical analysis across more than one timeframe, support and resistance, RSI, Elliott Wave and price action, plus gold fundamental analysis covering US news, the Fed, the US dollar and yields, and a check of how the previous update played out.
Which news moves the gold price the most?
US inflation reports such as CPI and PCE, the jobs report (NFP), Fed rate decisions and comments from Fed officials can move gold sharply. A stronger US dollar and higher Treasury yields often pressure gold, but these relationships can change.
How do I use gold support and resistance levels?
Treat support and resistance as zones where price may react, not guaranteed turning points. Look for price confirmation and plan your position size and stop loss around your trade's invalidation level and risk limit.
Is this gold forecast a trading signal?
No. It is educational market analysis. For ready trade ideas with entry, stop loss and take profit, follow the free FWE Telegram channel or the Forex Signals by FWE app.
About Our Daily Gold Analysis Today
This page is the ForexWaveExpert daily gold analysis. We update it every trading day at the same address, so you always find the latest XAUUSD analysis today in one place. Each update covers the gold price today, gold technical analysis and gold fundamental analysis, written by the FWE trading team.
Every daily update checks the same parameters, so you can compare one day with the next:
- Trend direction across more than one timeframe
- Gold support and resistance today, with supply and demand zones
- RSI momentum, overbought and oversold levels and divergence
- Elliott Wave count and price action patterns
- Key levels table with bullish and bearish scenarios and their invalidation
- Gold news today: US data, Fed rate expectations, the US dollar and Treasury yields
- Weekly COT positioning and the monthly central bank and gold ETF report, when new data is out
Bookmark this page for the gold forecast today, the XAUUSD forecast for the coming sessions and the key levels to watch before the London and New York opens. Use it to plan your own trades, together with your own analysis and risk management.
FWE Gold Market View: How We Analyse Gold
We read gold from the higher timeframe down: the bigger trend and Elliott Wave count first, then the entry timeframes for price action. A level only counts when price has reacted there before, so we mark support and resistance as zones, not single prices. RSI and Fibonacci retracements help us judge whether a move is stretched or still has room. Every update also says what would prove the view wrong, because no gold forecast is guaranteed.
Free Forex Signals App: Forex Signals by FWE
Get free gold signals, free XAUUSD signals and free forex signals on your phone. Every new gold buy sell signal arrives as a notification, with entry, stop loss and take profit, plus our daily gold updates.
Android: Download on Google Play | iPhone: Get the app for iPhone
Trading gold and other CFDs carries a high risk of loss, and price can move fast around US data. This is an analysis of probabilities, not a signal or financial advice. Never risk money you cannot afford to lose.
Gold COT Report This Week: What Hedge Funds Are Doing
The latest gold COT report from the CFTC (COMEX gold futures, positions as of Tuesday 3 November) shows hedge funds still heavily long, but a little less than the week before. Each contract is 100 troy ounces. Open interest rose by 2,359 to 399,169 contracts.
| Group | Long | Short | Net | Weekly net change |
|---|---|---|---|---|
| Managed Money (hedge funds, CTAs) | 122,283 | 18,669 | +103,614 | -1,948 |
| Producers / Merchants | 18,914 | 27,826 | -8,912 | +662 |
| Swap Dealers (banks) | 19,301 | 215,291 | -195,990 | +10,060 |
| Other Reportables | 98,247 | 22,313 | +75,934 | -4,955 |
| Small traders | 46,024 | 20,670 | +25,354 | -3,819 |
Managed Money trimmed its net long by 1,948 contracts. Longs barely moved while shorts rose by 1,723, so the funds are not rushing for the exit. Their long share is about 87% of all their positions, which is a crowded long. That does not predict a fall, but a sharp drop could force more selling. It fits our cautious view this week: the funds still back gold, yet they are not adding fuel.
This data is from last Tuesday, before the midterm rally and Friday’s jobs report. Use it for the bigger picture, not for intraday timing.
Editorial Note: The charts and technical analysis in this post are prepared by the ForexWaveExpert (FWE) trading team. Every post is reviewed, fact-checked and corrected by Rana Das, Founder & CEO of ForexWaveExpert, a gold trader with 15+ years of experience in Elliott Wave and Price Action and winner of the Fastbull Best Mentor Award 2024. This analysis is for educational purposes only and is not financial advice.