

This is the archived FWE gold analysis from 19 November 2026. The latest update is always on Gold Analysis Today.
Last updated: 19 November 2026, 12:36 PM (Bangladesh time, GMT+6)
Gold analysis today centres on whether 3700 holds. Gold dipped to about 3693 overnight, its lowest level in 14 months, before recovering into the 3720s. We still read this as the late stage of wave (iv), a correction inside a bigger uptrend. We are not buying yet. A daily close well under 3700 would point towards 3000, not a rally.
Gold Today at a Glance
- Gold price today: recovering after Wednesday’s sharp fall.
- Main news: hawkish Fed minutes, a firm dollar and a December rate decision on 9 December.
- FWE bias: wave (iv) is close to done but not confirmed. No buy until a reversal shows. Sell only a failed bounce.
Gold Technical Analysis Today
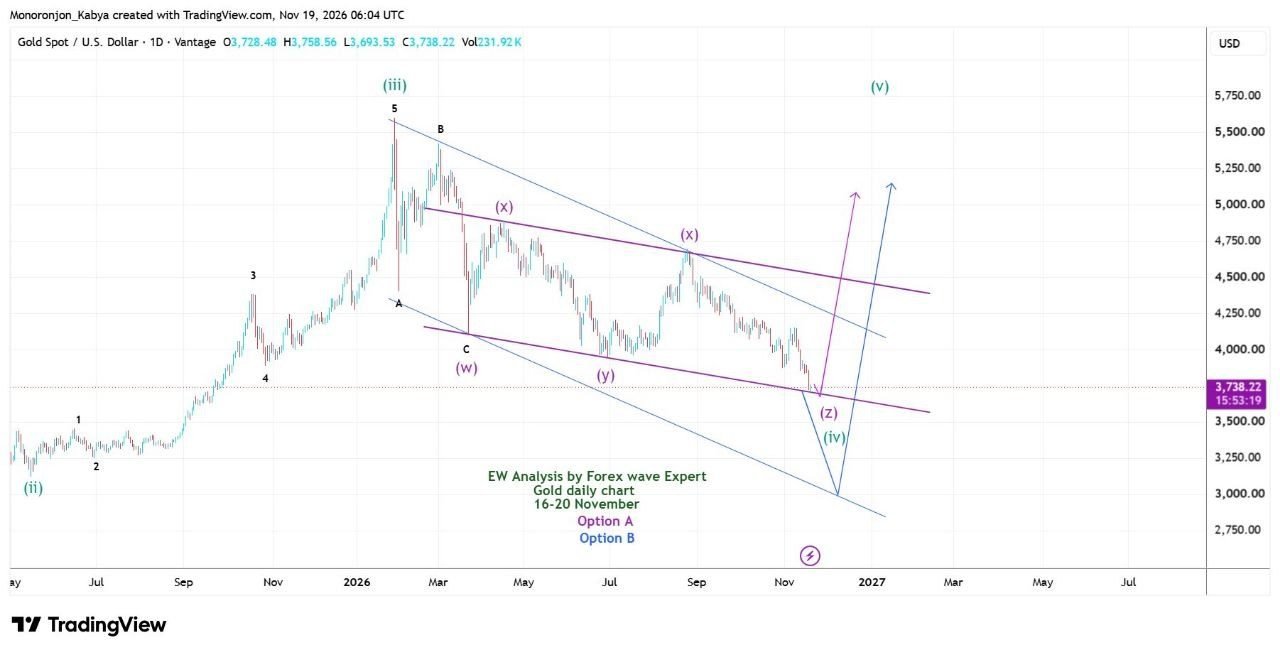
We count the decline from the 2026 high near 5590 as a W-X-Y-X-Z correction within wave (iv). The last leg, wave (z), has reached the lower trend line around 3700. Our preferred view is that the correction could end here. We are watching two scenarios.
- Option A: wave (z) ends near 3700. Gold turns up in wave (v), with a projection toward roughly 5050.
- Option B: the drop continues to the bottom of the wider channel near 3000. The rally starts from there and projects toward 5150.
Both projections cover months, so neither is an intraday target. Wave (v) only matters once a reversal actually shows.
Overnight price action
Gold fell through our first target at 3750 on Wednesday and reached the 3700 area overnight. The dip to about 3693 was followed by a recovery. That bounce is a reaction, not a reversal. Option A needs a daily close back above 3700, followed by a hold above it.
Other levels to watch
After a drop of about 3%, the first bounce often stalls near broken support, so 3780 to 3800 is a likely ceiling in our read. If 3700 gives way, public market views point to the 3600 area next, before the 3000 area on our Option B path. The 3780 to 3800 and 3600 levels are not taken from our chart.
Gold support and resistance today
| Level | Price | Source | Why it matters |
|---|---|---|---|
| Bear view cancelled | 4030 | FWE (yesterday’s update) | A daily close above it cancels the bearish view. |
| Upper sell zone | 3899-3901 | FWE (yesterday’s update) | An H4 close above it ends the sell idea from the lower zone. |
| Main sell zone | 3820-3842 | FWE (yesterday’s update) | Old support, now resistance. A failed retest favours sellers. |
| Pivot | 3800 | FWE (yesterday’s update) | Round number that broke. Likely first ceiling for a bounce. |
| Option A support | 3700 | FWE chart | Lower trend line, where wave (z) may end. The overnight dip went to about 3693. |
| Next support | 3600 area | Public market views | Possible stop if 3700 breaks on a daily close. |
| Option B target | 3000 | FWE chart | Bottom of the wider channel. The deeper scenario. |
Gold Analysis Today: Trade Plan and Invalidation
This is an opinion about probabilities, not a signal. Our plan from yesterday still fits the chart.
- Stay out: selling between 3693 and 3740. Chasing a fall into a trend line gives a poor entry, and our sell off rules for gold explain why.
- Sell: wait for a rejection on the H1 chart at the 3800 pivot or inside 3820-3842. A long upper wick or a bearish close is what we want to see. Our stop for that zone sits above 3880. Use the gold stop loss methods and size the trade with the lot size guide. Spread and slippage change real results.
- Buy: only after a clear H4 reversal near 3700 and an H4 close back above 3800. Keep it small, with 3842 as the first target. This is a counter trend trade.
Invalidation: a daily close well below 3700 means Option A failed and Option B becomes the main count. A daily close above 4030 cancels the bearish view.
Gold Fundamental Analysis Today
Gold news today: hawkish minutes and a firm dollar
The Fed minutes came out on Wednesday 18 November and cover the October 27 to 28 meeting, when the Fed held rates at 3.75% to 4%. Almost all participants judged that further rate increases would likely be appropriate. A couple said a move larger than 25 basis points could warrant consideration in December if inflation data were unfavourable. These are views from the October meeting, not guidance for December. Markets favour a quarter point increase in December, with roughly a one in ten chance of a half point move.
The US dollar hit fresh 19 month highs on renewed US and Iran tension and hawkish Fed talk. US Treasury yields are above 5%, which raises the cost of holding gold because gold pays no interest.
Rates may not explain the whole decline. Shares and Bitcoin also fell, which may point to broader selling rather than a gold only move. That distinction matters, but the sell off alone does not tell us when gold will stabilise.
Gold COT Report This Week: What Hedge Funds Are Doing
The latest verified CFTC Commitments of Traders report covers positions held on 10 November and was released on Monday 16 November, because of the US holiday on 11 November. These positions predate this week’s sell off.
| Group | Long | Short | Net |
|---|---|---|---|
| Managed Money (hedge funds and commodity trading advisers) | 127,406 | 15,065 | +112,341 |
| Swap Dealers (mostly banks) | 18,336 | 224,977 | -206,641 |
Managed money increased its net long position by 8,727 contracts in the week covered by the report. The increase came from both fresh longs and fewer shorts. The group remained heavily net long. Those longs could be vulnerable if support breaks, but this report cannot confirm that selling has begun. Use this older positioning data as background, not as an entry trigger.
What to Watch Next
- Fed speakers, who could move the dollar and gold at short notice.
- The Fed decision on 9 December. Read our plan for trading gold during FOMC before then.
- Price: a daily close under 3700 favours Option B. An H4 close above 3800 is the first sign that buyers are back.
Yesterday’s Gold Analysis: What Changed? (Wednesday 18 November)
Read the full previous update: Gold Analysis 18 November 2026.
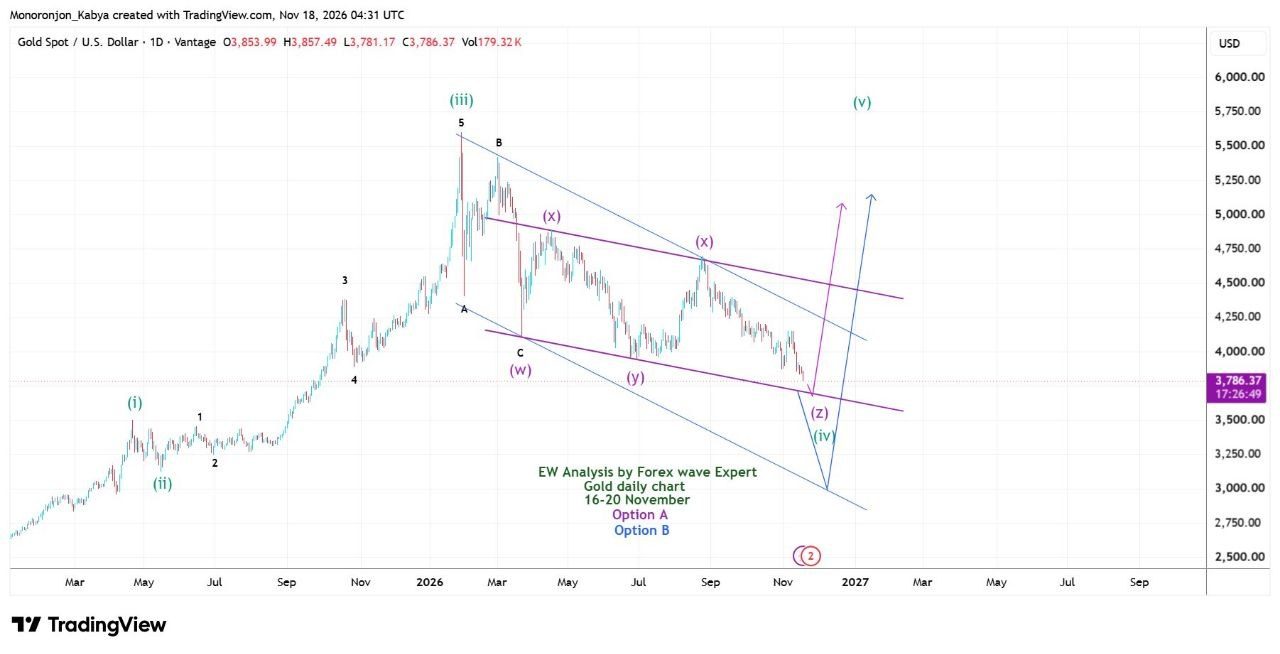
- Our call then: sell failed bounces below 3842, with the main zone at 3820-3842, a stop above 3880 and targets at 3750 and 3700. We said to stay out of the drop between 3786 and 3800.
- What happened: Wednesday’s reports put gold below 3800 and later near 3725. The move towards 3700 followed overnight. We have not verified whether price returned to 3820-3842, so we cannot say whether the entry triggered. The decline continued, but that alone does not establish that our entry conditions were met.
- Bigger view: wave (z) has reached the lower trend line, but neither scenario is confirmed.
- What changed today: price is now at our 3700 support, so the sell zone is further away and 3800 is the first level to watch.
Follow our Telegram channel for gold and forex updates.
Gold Analysis Today FAQ
How often is this gold analysis today updated?
Every trading day, Monday to Friday. The page keeps the same address and each update replaces the previous one, with a short summary of what gold did since the last update.
What does the daily XAUUSD analysis include?
Gold technical analysis across more than one timeframe, support and resistance, RSI, Elliott Wave and price action, plus gold fundamental analysis covering US news, the Fed, the US dollar and yields, and a check of how the previous update played out.
Which news moves the gold price the most?
US inflation reports such as CPI and PCE, the jobs report (NFP), Fed rate decisions and comments from Fed officials can move gold sharply. A stronger US dollar and higher Treasury yields often pressure gold, but these relationships can change.
How do I use gold support and resistance levels?
Treat support and resistance as zones where price may react, not guaranteed turning points. Look for price confirmation and plan your position size and stop loss around your trade's invalidation level and risk limit.
Is this gold forecast a trading signal?
No. It is educational market analysis. For ready trade ideas with entry, stop loss and take profit, follow the free FWE Telegram channel or the Forex Signals by FWE app.
About Our Daily Gold Analysis Today
This page is the ForexWaveExpert daily gold analysis. We update it every trading day at the same address, so you always find the latest XAUUSD analysis today in one place. Each update covers the gold price today, gold technical analysis and gold fundamental analysis, written by the FWE trading team.
Every daily update checks the same parameters, so you can compare one day with the next:
- Trend direction across more than one timeframe
- Gold support and resistance today, with supply and demand zones
- RSI momentum, overbought and oversold levels and divergence
- Elliott Wave count and price action patterns
- Key levels table with bullish and bearish scenarios and their invalidation
- Gold news today: US data, Fed rate expectations, the US dollar and Treasury yields
- Weekly COT positioning and the monthly central bank and gold ETF report, when new data is out
Bookmark this page for the gold forecast today, the XAUUSD forecast for the coming sessions and the key levels to watch before the London and New York opens. Use it to plan your own trades, together with your own analysis and risk management.
FWE Gold Market View: How We Analyse Gold
We read gold from the higher timeframe down: the bigger trend and Elliott Wave count first, then the entry timeframes for price action. A level only counts when price has reacted there before, so we mark support and resistance as zones, not single prices. RSI and Fibonacci retracements help us judge whether a move is stretched or still has room. Every update also says what would prove the view wrong, because no gold forecast is guaranteed.
Free Forex Signals App: Forex Signals by FWE
Get free gold signals, free XAUUSD signals and free forex signals on your phone. Every new gold buy sell signal arrives as a notification, with entry, stop loss and take profit, plus our daily gold updates.
Android: Download on Google Play | iPhone: Get the app for iPhone
Trading leveraged gold and forex carries a high risk of loss. This analysis is not personal financial advice. Use a stop loss and risk only what you can afford to lose.
Editorial Note: The charts and technical analysis in this post are prepared by the ForexWaveExpert (FWE) trading team. Every post is reviewed, fact-checked and corrected by Rana Das, Founder & CEO of ForexWaveExpert, a gold trader with 15+ years of experience in Elliott Wave and Price Action and winner of the Fastbull Best Mentor Award 2024. This analysis is for educational purposes only and is not financial advice.