
Elliott Wave Gold Analysis By Durjoy K. (Technical Trainee Analyst)
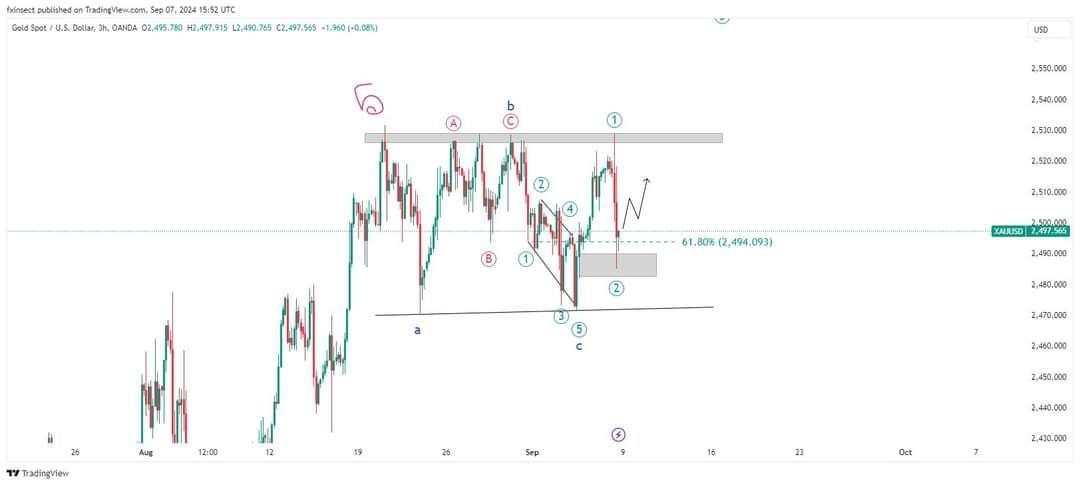
In my recent Elliott Wave Gold Analysis of the gold market, we observed significant activity in the gold price on September 7, 2024. The price hit a major supply zone between 2526 and 2532, marking the completion of wave 5. As a result, the market entered a classic corrective pattern, providing insights for the next move.
Corrective Wave and Market Behavior
The gold market formed waves A, B, and C in the correction, with wave C presenting an ending diagonal pattern. This typically signals a market bottom or the end of a correction. The Elliott Wave theory tells us that after such a correction, the market is likely to resume its primary trend.
Impulse Formation and Wave Count
Following the correction, gold prices surged, forming a new impulse wave, counted as wave 1. After this move, the market corrected again, retracing to the 61.8% Fibonacci retracement level, forming wave 2. This retracement is common in Elliott Wave theory, and it adhered to the standard pullback range of 61.8% to 78.6%.
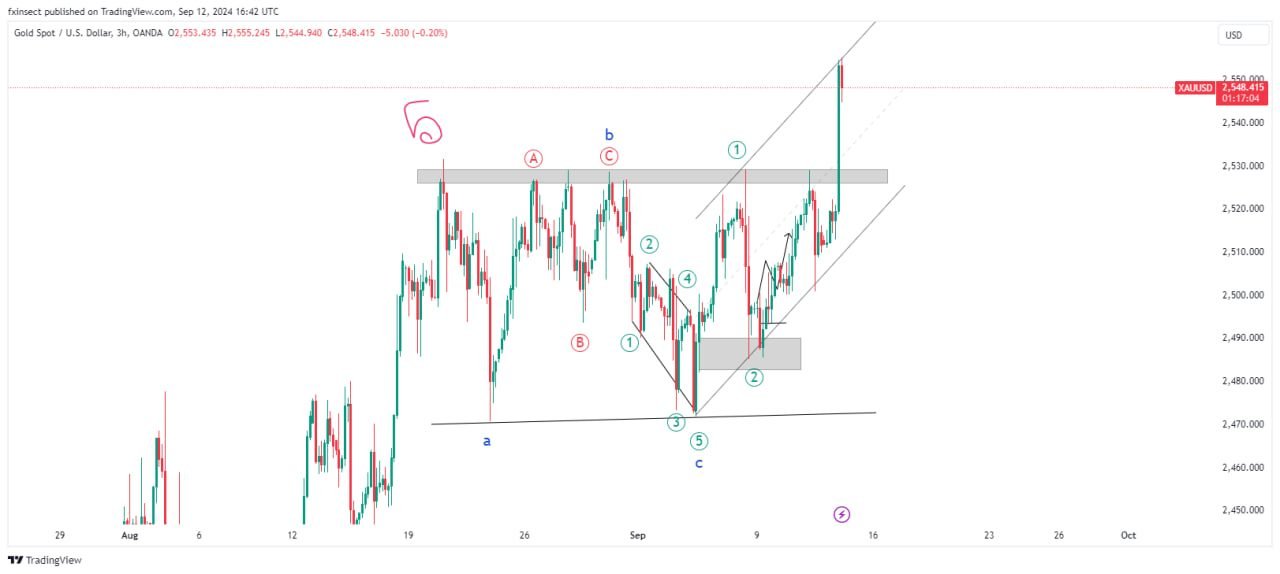
500+ Pip Move: Confirmation of Wave 3
After the wave 2 correction, gold prices rallied by over 500 pips, confirming the start of wave 3. This strong upward move reaffirms the bullish momentum in the gold market. Wave 3 is typically the most powerful wave in the Elliott sequence, indicating further potential for significant gains in gold prices.
Top prop firm review in 2024
Conclusion:
The Elliott Wave analysis of gold signals that the market correction is over, and the beginning of wave 3 presents a strong bullish opportunity. Monitoring gold price movements closely could provide valuable trading signals for those looking to capitalize on the next wave.
Add a Comment
You must be logged in to post a comment