
Elliott Waves and Fibonacci: A Harmonious Relationship Part 4
# Market Secrets Unveiled: The Symphony of Elliott Waves and Fibonacci Harmony
## Fibonacci’s Marvelous Journey:
Embark on a journey through history, guided by the brilliance of Leonardo Fibonacci. In 1203, Fibonacci uncovered a magical sequence in rabbit breeding, giving birth to the Fibonacci sequence—a numerical marvel woven into the tapestry of mathematics.
## Fibonacci’s Role in Elliott Wave Analysis: Elliott Waves and Fibonacci Relationship
 In the world of trading, Fibonacci tools are more than mere instruments; they’re essential guides in Elliott Wave analysis. Imagine them as market soothsayers, aligning with Fibonacci sequence levels to predict future market moves. Traders use these tools to uncover hidden patterns and foresee where the market might progress next.
## Harmony of Elliott Waves and Fibonacci Numbers:
Elliott Wave analysis and Fibonacci numbers create beautiful music together. It’s not just theory; it’s a practical symphony for traders, harmonizing the complex movements of market trends and Fibonacci’s rhythmic sequence.
## Why Fibonacci is a Market Maestro in Elliott Wave:
Cutting to the chase—Fibonacci is a big deal in Elliott Wave analysis. When counting waves, Fibonacci levels act like breadcrumbs, guiding traders to potential reversal points, trend extensions, and correction patterns. It’s like having a secret map through the market maze.
## Elliott Waves and Fibonacci: Your Partner in Wave Spotting:
Ever wonder how traders spot potential reversals during corrective waves? Enter Fibonacci retracement levels, like 38.2%, 50%, and 61.8%. Think of these as checkpoints where price corrections might pause or change direction. Traders love these levels because they help anticipate market twists and turns.
## Fibonacci Extensions: Predicting the Next Market Act:
Now, let’s talk about extensions—Fibonacci’s crystal ball for projecting future price movements during impulse waves. Traders use extensions beyond the 100% level to pinpoint where the next wave might make its mark. It’s like predicting the future of market trends.
## Fibonacci and Time: A Dynamic Duo:
But wait, there’s more! Fibonacci ratios aren’t just about prices; they’re time wizards too. Waves often follow Fibonacci ratios in duration, helping traders estimate when a wave might take its final bow. This time aspect adds a dash of precision to Elliott Wave analysis.
## How to Write Fibonacci Numbers:
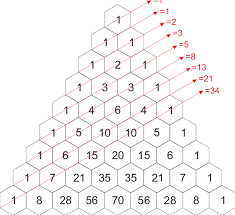
Writing the Fibonacci sequence involves adding the two preceding numbers to get the next one: 0, 1, 1, 2, 3, 5, 8, 13, 21, and so on. In other words, each number in the sequence is the sum of the two numbers that precede it. So, if you take any two consecutive numbers, such as 8 and 13, and add them together (8 + 13), you’ll obtain the next number in the sequence, in this case, 21. This pattern continues indefinitely, creating the mesmerizing and infinite Fibonacci sequence.
## How to Uncover Fibonacci Ratios:
Now, let’s demystify the magic behind Fibonacci ratios. It’s like a mathematical treasure hunt. Here’s how traders often find these ratios:
1. **Golden Ratio (0.618):** Take any Fibonacci number and divide it by its next consecutive number. For example, 34 divided by 55 gives approximately 0.618.
2. **Inverse Golden Ratio (1.618):** Conversely, find 1.618 by dividing a Fibonacci number by its preceding number. For instance, 55 divided by 34 equals approximately 1.618.
These ratios, particularly 0.618 and 1.618, are known as the Fibonacci Golden Mean/Ratio. Here’s a quick chart to illustrate:
| Fibonacci Number | Divided by Next Fibonacci Number | Ratio (Next/Current) |
| 8 | 13 | 0.615 |
| 13 | 21 | 0.619 |
| 21 | 34 | 0.618 |
| 34 | 55 | 0.618 |
| 55 | 89 | 0.618 |
| …… | …… | …… |
This chart showcases the continual play of Fibonacci ratios, offering traders a roadmap to navigate the rhythmic patterns of the market.
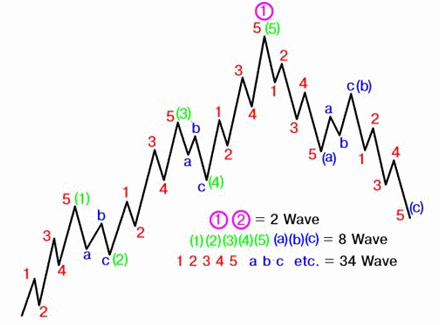
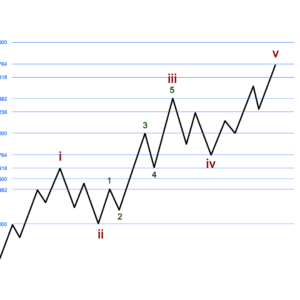
## Elliott Wave Counts:

In Elliott Wave analysis, practitioners count waves in a structured manner:
– **12345:** This sequence represents an impulse wave, marking the upward movement.
– **ABCDE:** This corrective wave consists of various patterns like zigzags or triangles, signifying a market retracement.
### Wave Cycle:
– **5 Impulse, 3 Corrective:** This cycle mirrors the Fibonacci sequence, capturing the ebb and flow of market dynamics.
– **21 Waves:** A comprehensive view involves counting 21 waves, providing a nuanced understanding of market movements.
## Charting the Symphony:
As we delve into the Fibonacci symphony, consider this chart showcasing how Fibonacci ratios guide traders through market movements.
## Conclusion: Elliott Waves and Fibonacci
As we unravel the secrets of Elliott Wave analysis, remember that Fibonacci is our trusty sidekick. Together, they bring order to the market chaos, offering traders a roadmap to navigate the twists and turns. Stay tuned for more adventures in the next Elliott Wave Learning installment, where we’ll dive into specific applications and advanced techniques, making the market symphony a little more predictable. Happy trading!
Add a Comment
You must be logged in to post a comment