
A Comprehensive Technical Analysis of XAUUSD: M15, H2, and Daily Timeframes
Technical analysis of XAUUSD: Gold (XAUUSD) is a critical asset for traders due to its stability and role as a safe-haven investment. Traders often analyze multiple timeframes to gauge market conditions and find optimal entry and exit points. In this blog post, we will analyze the XAUUSD market using the M15, H2, and daily timeframes, blending short-term and long-term perspectives to give a holistic view of possible price action.
M15 Timeframe Technical Analysis of XAUUSD: Short-Term Moves
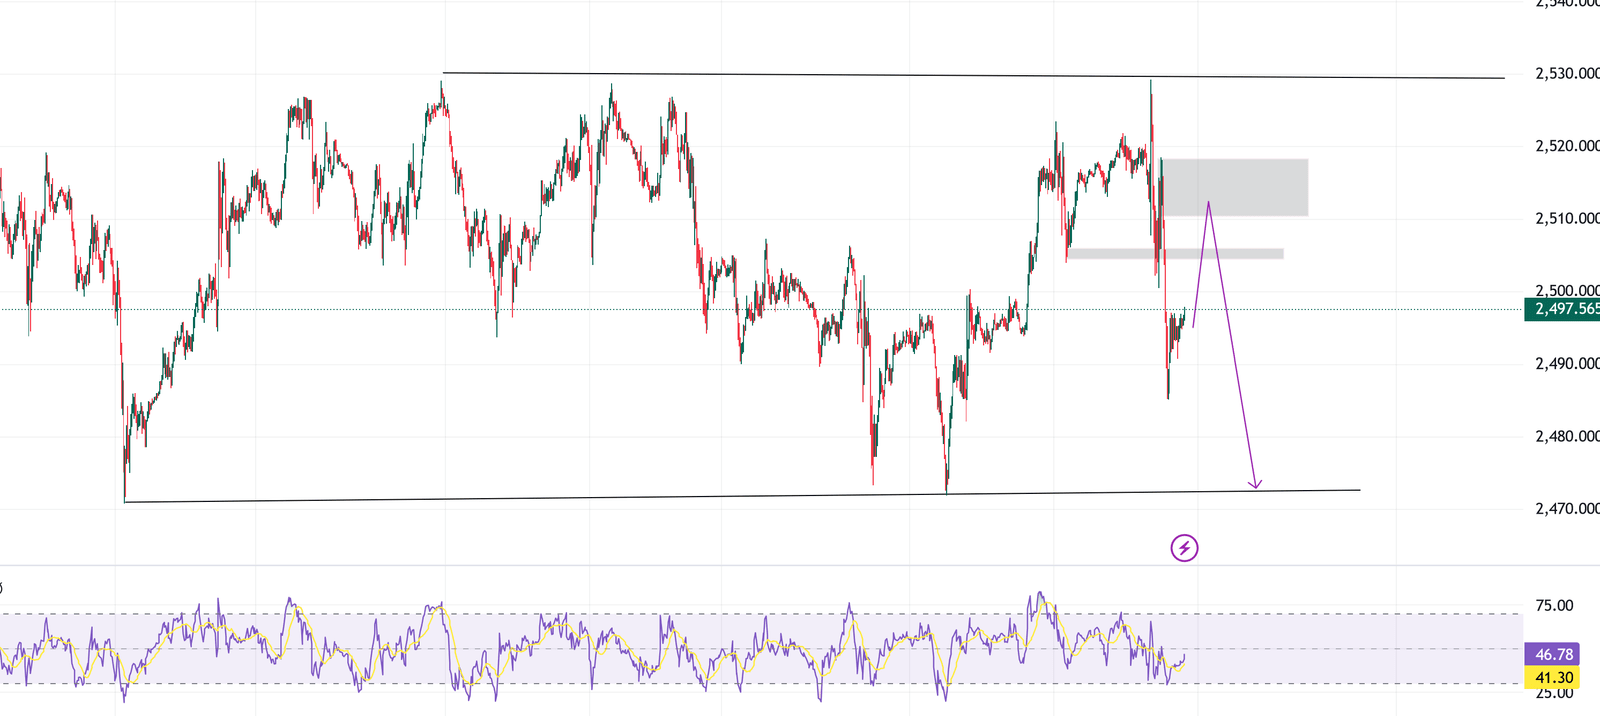
On the M15 chart, XAUUSD appears to be in a consolidation phase within a defined range. Key features include:
- Supply Zone: Around the 2,510 – 2,520 mark, a significant supply zone has been repeatedly tested but has consistently led to rejections, indicating strong selling pressure at this level.
- Potential Rejection: Price may be gearing up to retest this zone. If the rejection occurs again, we can anticipate a bearish move toward the lower boundary of the range at 2,470.
- RSI Levels: The RSI indicator is hovering around neutral, neither overbought nor oversold, suggesting that we might see further consolidation before any major move.
In conclusion, M15 shows potential for a bearish continuation if the price fails to break above the supply zone. Traders can look for short opportunities if the price rejects this resistance level.
H2 Timeframe Technical Analysis of XAUUSD: Mid-Term View
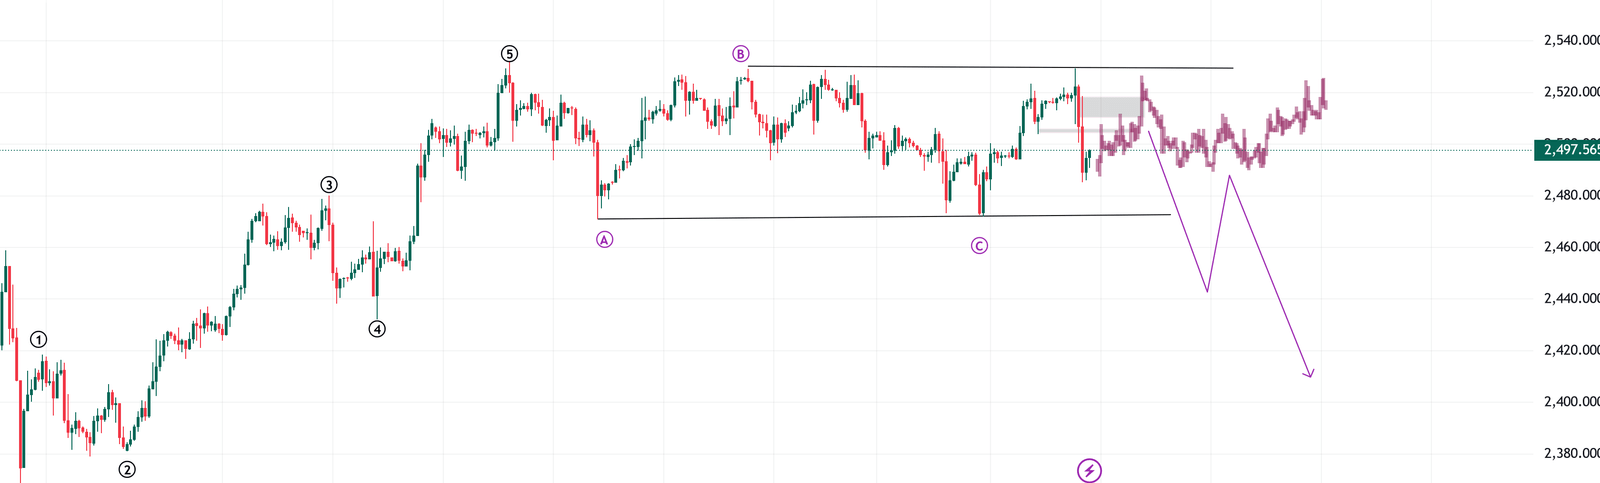
On the H2 chart, we see a more structured price action with a potential Elliott Wave formation. This suggests that a corrective move could be underway:
- Elliott Wave Structure: The wave analysis on the hourly chart suggests that the Elliott Wave cycle 1-2-3-4-5 followed by the ABC correction has been completed. However, there is a possibility that the pattern could evolve into a more complex correction, such as an X-W-Z pattern. If it develops into this complex form, we could see the price falling further, possibly entering a ranging or sliding down phase. Keep an eye on how the price action unfolds to confirm whether it will continue in the current pattern or transition into a more complex structure.
- Channel Pattern: The price is moving within an ascending channel, indicating a general bullish trend. If Wave 4 completes near the lower boundary of the channel (around 2,470), we might see a sharp reversal toward the upside.
- Key Level: The 2,470 support is crucial for the continuation of the bullish wave structure. If this level holds, we could see a new high forming around 2,530 and potentially higher.
Thus, on the H2 timeframe, a corrective move to the downside could happen first, but it is likely to be followed by a bullish reversal, making this a good opportunity for medium-term traders to prepare for a long position.
Daily Timeframe Technical Analysis of XAUUSD: Long-Term Perspective
The daily chart reveals a broader context:
- Elliott Wave Structure: On the daily chart, it currently shows an impulse wave, but it could also be forming an ending diagonal. If it develops into an ending diagonal, we might see a sharp decline once the pattern completes. However, if the price continues to move upward and the impulse wave remains intact, the price could climb even higher. Keep a close watch to see if the structure confirms an ending diagonal, as this will signal a potential reversal, followed by a significant upward move once the correction is complete.
- Range-Bound Market: On the daily timeframe, XAUUSD has been trading in a broad range between 2,470 (support) and 2,530 (resistance), with the market oscillating between these levels.
- Double Top Formation: There is a potential double top forming around the 2,530 resistance, which could signal a bearish reversal if the price fails to break higher. This pattern often indicates that selling pressure is overwhelming buying interest, leading to a decline in price.
- Breakout Scenarios: A clear break above the 2,530 resistance could open the door for a move toward higher levels, possibly reaching 2,560 or even 2,600. Conversely, a failure to sustain above 2,530 could result in a significant bearish move, targeting the 2,420 level.

Combining All Timeframes
By combining the insights from the M15, H2, and daily charts, we can form a more comprehensive outlook:
- Short-Term: The M15 chart points to potential bearish action if the price fails to break above the supply zone around 2,510.
- Mid-Term: The H2 chart suggests that we are likely in a Wave cycle in corrective, making ranging market movements. The correction might drop to the 2,470 level before the next upward push.
- Long-Term: The daily timeframe shows a potential double-top formation near 2,530, which could either confirm a bearish reversal or lead to a breakout above this critical resistance.
Conclusion
XAUUSD appears to be at a pivotal point across all three timeframes. In the short term, traders should watch for a rejection at the 2,510 – 2,520 supply zone on the M15 chart. If the price holds above this level, the H2 chart suggests a potential bullish move to complete Wave 5 of the Elliott Wave structure, targeting the 2,530 area and beyond.
On the daily timeframe, however, the double-top pattern near 2,530 could result in either a breakout to the upside or a bearish reversal, depending on whether the price can sustain a move above this key level.
Overall, traders should prepare for both bullish and bearish scenarios by carefully watching key levels such as 2,470 (support) and 2,530 (resistance), and by paying close attention to short-term price action and confirmations.
Disclaimer: This analysis is for informational purposes only. It should not be considered financial advice. Always perform your own research and analysis before making any trading decisions.
Add a Comment
You must be logged in to post a comment