

Gold analysis today: XAUUSD is trading just under 4000, still inside a falling daily channel, and FWE keeps a bearish bias while price stays below the 4040-4105 area. Our daily chart from 23 October called a break, a retest and a drop. The first two have happened. Now the focus is H4 demand at 3955-4000, with a daily zone at 3915-3945 below it.
Gold Today at a Glance
- Gold price: near 3995, a little lower today after a weak Thursday pushed it back to the 4000 level.
- Main news: strong US growth and firmer PCE inflation keep a December Fed hike likely. Oil is still above 110.
- FWE bias: bearish while price stays below 4040-4105. A bounce from demand is possible, but we would use it as a chance to sell, not as a change of trend.
- Key support: 3955-4000, then 3915-3945.
- Key resistance: 4070-4080, then 4105-4120.
Gold Analysis Today: The Retest We Expected Did Happen
On 23 October gold sat near 4000 after losing the 4070 shelf, where the 7 and 14 October lows had held. Our daily view was simple. Support had broken, so a pullback into that broken area was likely. We expected sellers to step in there before the next leg down inside the channel that has been falling since April.
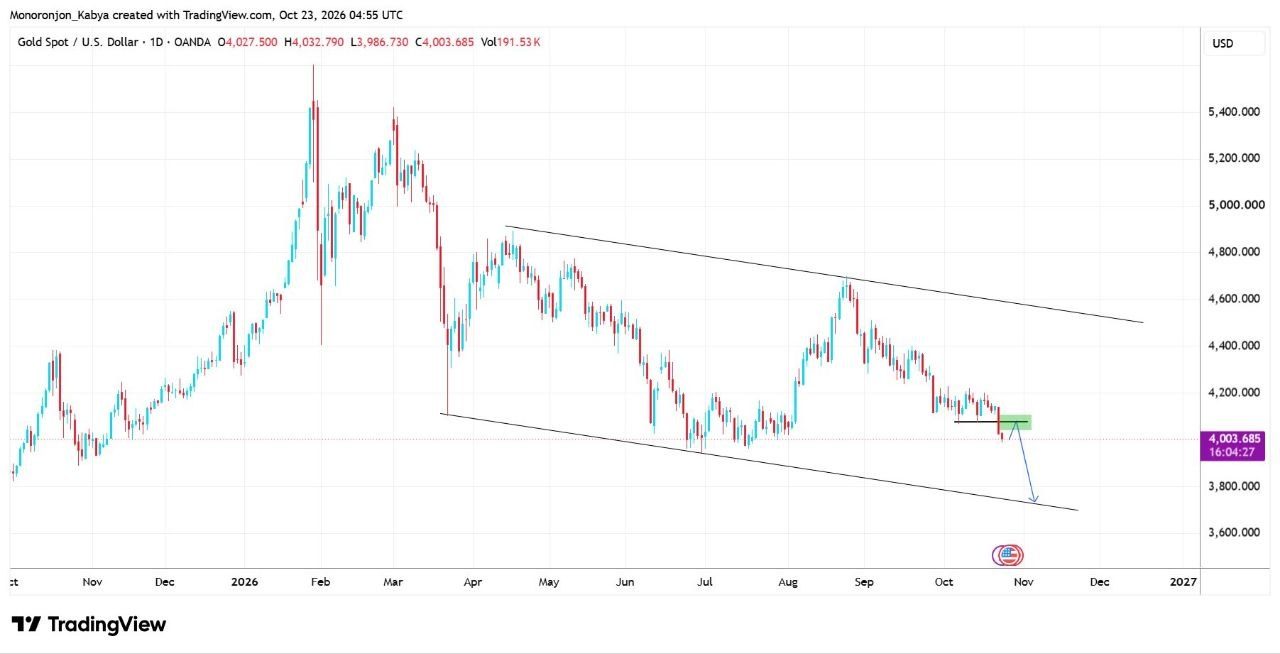
That is how it played out. Gold bounced off the low and pushed up to about 4080 earlier this week, inside the 4040-4105 retest zone we had marked. Then it turned down and now sits at 4000 again. The projected end point on that chart, the lower channel line near 3750, is a multi week target. Price has not reached it, and nobody should trade it as an intraday level.
We also need to be straight about one miss. Yesterday we leaned toward a bounce to 4100-4110. Price stopped 20 to 30 points short, and 4080 capped it. So the retest idea worked, but the bounce target did not. In our 29 October gold technical analysis we named 3975 as the level that cancels the bounce. Price has not closed below it yet, though it is close.
4 Hour Chart: Price Is Sitting on H4 Demand
The FWE 4 hour chart tells the same story up close. Gold failed at the 4075-4100 supply area, which is the old shelf from the daily chart, and slid back into H4 demand at roughly 3955-4000. The bigger daily zone, roughly 3915-3945, sits underneath.
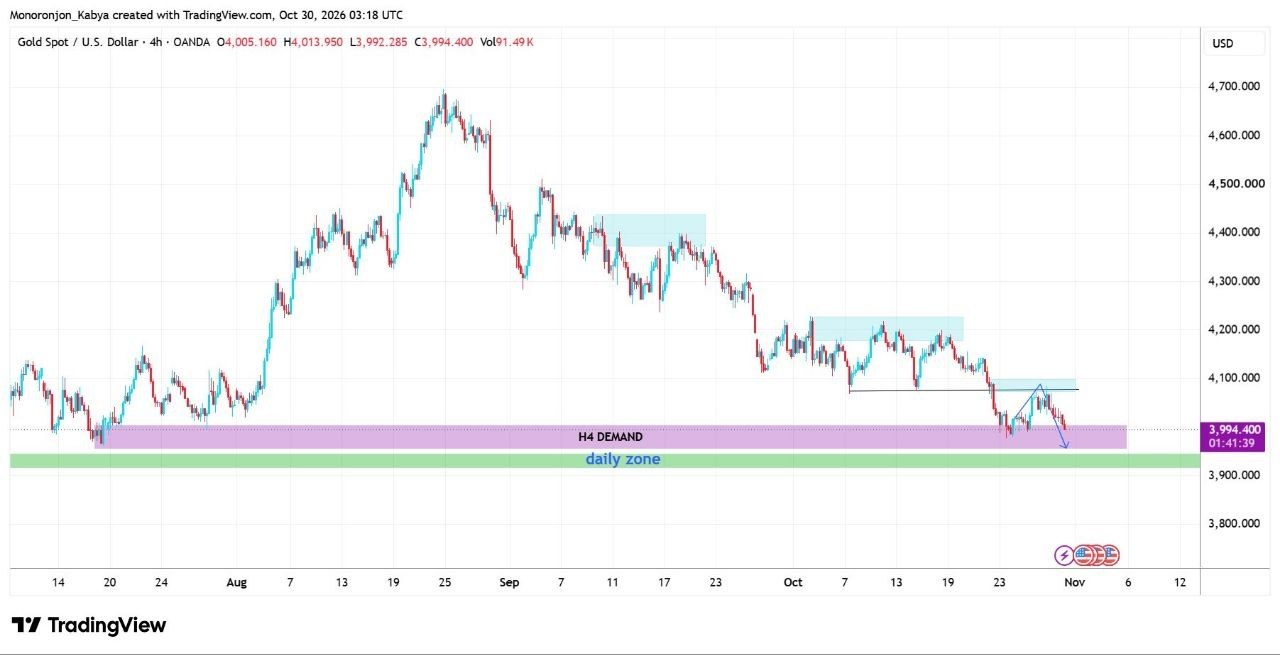
What does this mean for you as a trader? Demand zones often fail on the first test, and this one is being tested after a clear lower high. We expect a reaction somewhere between 3955 and 3915. If buyers do show up, the rebound should run into sellers again around 4040-4080. A 4 hour close below 3955 would tell us demand has given way and bring the daily zone into play.
Gold Next Plan
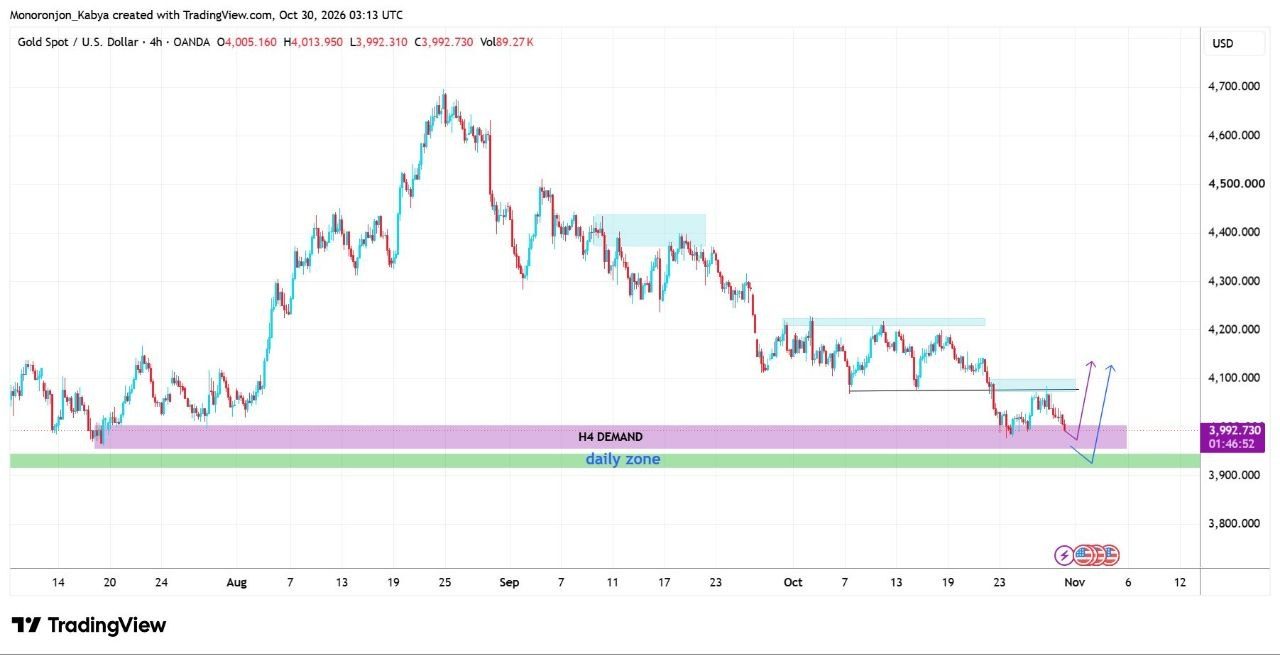
The FWE team sent a second 4 hour chart today with a short note: “Gold next plan”. It shows spot gold against the US dollar, stamped early on 30 October, with the last price at 3,992.73. The plan is a bounce, and it has two branches. Here is how to read it.
What the chart shows
- H4 demand: the purple box, from about 3955 up to about 4000. Price is inside its upper part.
- Daily zone: the green strip just below, from about 3915 to 3945.
- Supply above: a light blue box near 4075-4095, with a thin line near 4075 that marks the old shelf from early October.
- Two arrows: both dip first and then turn up, and both end a little above 4100.
One detail matters. The last 4 hour candle was still open when the chart was taken, so there was no confirmed close yet. A zone has not held until a candle closes and shows it.
Two bounce paths from demand
| Path | Where it starts | What we want to see | Where it heads |
|---|---|---|---|
| Purple arrow, shallow | Inside H4 demand, 3955-4000 | A 4 hour candle that rejects the lows and closes back up | 4075-4095 first, then a little above 4100 |
| Blue arrow, deeper | A dip through demand into the daily zone, 3915-3945 | A sharp turn after the sweep, with price closing back above 3955 | The same 4075-4095 area, then a little above 4100 |
In the deeper path, gold does not respect the demand zone. It pushes through it, takes out the stops sitting under the lows, and only then finds buyers. That kind of sweep is common near round numbers and recent lows. It is also why the daily zone is drawn on the chart.
How this fits our bearish view
A bounce plan does not cancel the bearish daily picture. Gold is still making lower highs inside the falling channel, so a rebound to 4075-4095 is a move inside that view. That supply box is also where this week’s bounce stalled, so it is the first place we expect sellers to return. Only a hold above 4095, and then a daily close above 4120, would start to weaken the bearish case.
So the two ideas work together. Buyers may get a short term bounce from the zones. Sellers still get the next look at 4075-4095.
How to use the plan without overtrading it
- Do not buy only because price touched a zone. Wait for a 4 hour candle to close and show a reaction.
- Put the stop beyond the zone you are trading from. Beginners often place it inside the zone and get taken out by the sweep.
- Choose your approach before you enter. A tight idea uses 3975 as the exit level from our 29 October note. The deeper idea gives gold room to dip into 3915-3945 first.
- Size the position so a stop hit costs 1% or less of the account.
Here is a hypothetical example. Your account is 10,000 USD and you risk 1%, which is 100 USD. You buy gold at 3975 after a 4 hour rejection, with the stop at 3905, below the daily zone. The stop is 70 points away. One standard lot is 100 ounces, so a 70 point move costs 7,000 USD per lot. A 0.01 lot (1 ounce) risks 70 USD, which is inside your 100 USD limit. A target at 4075 is 100 points away, so reward to risk is about 1.4 to 1. A target at 4100 is 125 points away, about 1.8 to 1. A tighter stop at 3945 would allow about 0.03 lots, but a sweep into the daily zone could hit it before the turn. Real results change with spreads, fees and slippage, so treat these numbers as a teaching example only.
The plan fails if a 4 hour candle closes below 3955. The shallow path is then dead, and only the deeper path is left. A daily close below 3915 cancels the bounce idea completely.
What Is Driving Gold Today
Thursday’s US data came in strong. Third quarter GDP grew 3.4%, ahead of the roughly 3.2% expected and up from 2.2% in the second quarter. PCE inflation also picked up in September. That keeps pressure on the Fed to tighten again.
The Fed held rates at 3.75% to 4.00% on Wednesday, with two members voting for a hike. Chair Warsh made no promise on December. Pricing for a December hike has eased a little since last week, but it is still high at roughly 75% to 85%, depending on the snapshot. Higher rates make gold less attractive, so this remains a headwind.
The dollar and yields are mixed today. The dollar index is slipping toward 101.7 and the 10 year yield is around 4.9%, yet gold has not rallied. In our reading, oil and Fed hike bets matter more for gold right now than a small dollar move. Silver fell about 3% on Thursday as well, so the whole metals group is under pressure.
Gold Support and Resistance Today
| Level | Price | Source | Why it matters |
|---|---|---|---|
| Channel retest ceiling | 4105-4120 | FWE chart and market data | Top of the daily retest zone and the 20 day EMA area. A daily close above it weakens the bearish view. |
| Broken shelf | 4070-4080 | FWE chart and market data | The retest high stopped here this week. |
| H4 demand | 3955-4000 | FWE chart | Price is testing it now. A bounce could start here. |
| Bounce invalidation from 29 Oct | 3975 | Previous FWE analysis | A 2 hour close below it ends the bounce idea. |
| Year to date low | 3941 | Market data | Sits inside the daily zone. |
| Daily zone | 3915-3945 | FWE chart | Next area where buyers may react. |
| Lower channel line | about 3750 | FWE chart | Multi week projection only, not a short term target. |
Treat these as zones, not exact prices. Spreads widen when news hits.
Gold Forecast Today: Scenarios
Bearish, our main view. Gold rebounds to 4040-4080 at most, sellers defend it, and price drops back to demand. A 4 hour close below 3955 opens 3915-3945. Only a daily close below 3915 would be a real move toward the lower channel.
Bounce first. H4 demand holds and gold squeezes higher. In that case we would treat 4040-4080 as a sell area, since the daily structure still shows lower highs and lower lows.
What proves us wrong. A daily close above 4120 would be the first sign the falling channel is losing control. Until then the bearish view stands. This is an opinion about probabilities, not a signal.
Gold Outlook Next Week
For the gold outlook next week, we expect a range of roughly 3915-4080 with a downward tilt, unless 4120 is reclaimed. Three things can move it. The US midterm elections are due next week, so expect thin liquidity and headline spikes. December Fed pricing will shift with every data point and speech. Oil and Middle East headlines are the third driver, because high oil keeps inflation fears alive.
Gold does gap over the weekend. If you hold a trade into the weekend, cut your size and keep the stop beyond the level that proves you wrong. Use our lot size guide to keep risk at 1% or less. Prop firm traders should read the news trading rules before holding through events. The daily call behind today’s update is in our 23 October XAUUSD outlook.
Follow daily gold updates on the FWE Telegram channel. In the next update we will check whether 3955 held and where the retest sellers stand now.
Trading gold and other CFDs carries a high risk of loss. This analysis is an opinion, not financial advice or a signal. Price can move against any view, so always use a stop loss and risk only what you can afford to lose.
Editorial Note: The charts and technical analysis in this post are prepared by the ForexWaveExpert (FWE) trading team. Every post is reviewed, fact-checked and corrected by Rana Das, Founder & CEO of ForexWaveExpert, a gold trader with 15+ years of experience in Elliott Wave and Price Action and winner of the Fastbull Best Mentor Award 2024. This analysis is for educational purposes only and is not financial advice.