

Gold chart analysis today shows XAUUSD bouncing above $4,000 after Friday’s three-month low. The FWE M15 chart marks a long idea from a base break, with the recent high at $4,033.22 as the target. At 15:46 GMT+6 on 26 October 2026 that chart showed price at $4,018.54. This is a short-term bounce inside a larger bearish picture, so the stop loss matters more than the target.
Gold Today at a Glance
- Gold price: $4,018.54 on the FWE OANDA M15 chart at 15:46 GMT+6. Kitco spot was $4,005.20, up $10.30 (+0.26%), at 12:18 GMT+6, with a day range of $3,977.90 to $4,020.20 at that time.
- Main news: The Fed meets on 27 and 28 October and a hold is widely expected. Oil prices and Middle East headlines still shape inflation fears.
- FWE bias: The M15 long idea stays valid while price holds above $3,978.54. The bigger swing view from 23 October stays bearish below the $4,070 to $4,100 zone.
- Key support: $3,996.76, then $3,978.54.
- Key resistance: $4,033.22, then $4,070.
FWE Gold Chart Analysis Today: XAUUSD M15 Base Break
The chart below is Gold Spot against the US dollar on the 15-minute timeframe (OANDA feed), created on 26 October 2026 at 09:46 UTC. The last candle shows an open of $4,018.92, a high of $4,019.22, a low of $4,017.67 and a close of $4,018.54.
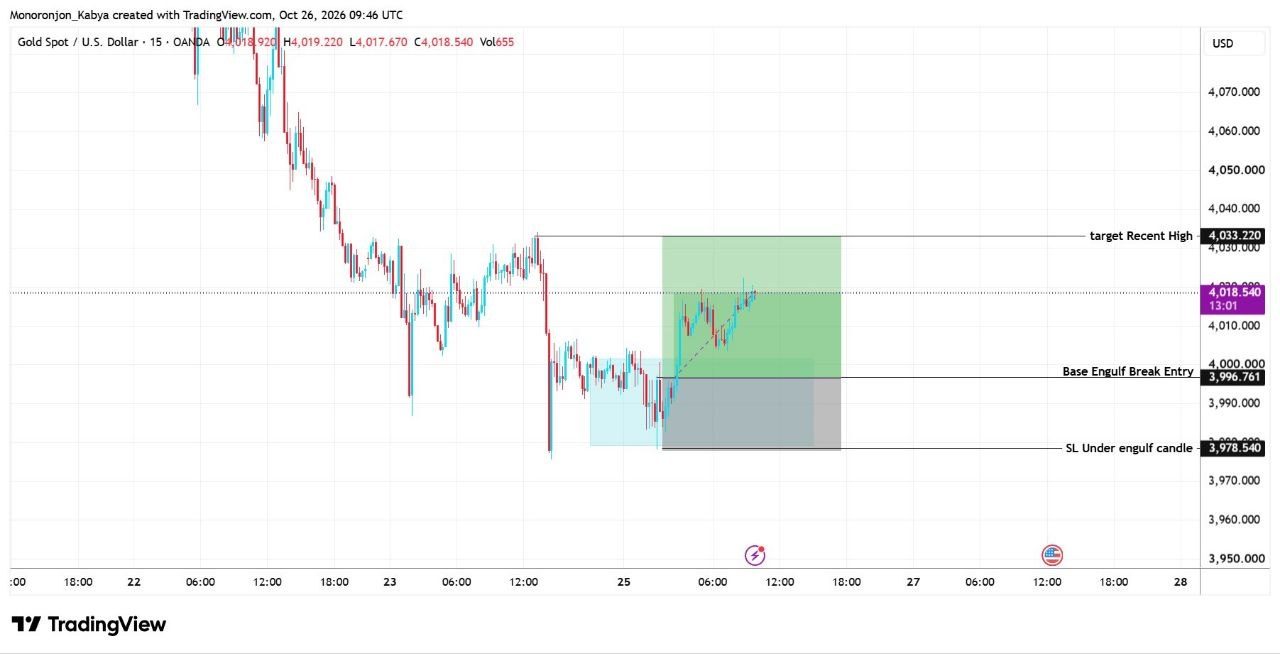
The FWE team’s note says the entry reason is a base break with an M15 engulf candle as confirmation. Here is what the chart marks:
- The base. The pale blue box shows a sideways range near the lows, ending around the $4,000 area. Price spent time here after the sharp fall on the left of the chart.
- The entry. The line labelled “Base Engulf Break Entry” sits at $3,996.761. A bullish engulfing candle (a candle whose body covers the previous candle’s body) closed through the base, and that gave the confirmation.
- The stop loss. The line labelled “SL Under engulf candle” is at $3,978.540, just below the engulf candle’s low.
- The target. The line labelled “target Recent High” is at $4,033.220. The green box runs from entry to target and the grey box from entry to stop.
The distances are easy to check. Risk is 3,996.761 minus 3,978.540, which is $18.22 (about 182 pips, with 1 pip = $0.10 on gold). Reward is 4,033.220 minus 3,996.761, which is $36.46 (about 365 pips). That gives a reward to risk ratio of 2.0 to 1. At $4,018.54, price is about $21.78 above the entry and about $14.68 below the target.
Worked example: sizing this setup (hypothetical)
Say your account is $10,000 and you risk 1%, which is $100. One standard lot of gold is 100 ounces, so a $1 move equals $100 per lot. A stop of $18.22 on one lot loses $1,822. Divide $100 by $1,822 and you get 0.055 lot, so you would round down to 0.05 lot. At 0.05 lot (5 ounces), the stop risks about $91 and the target is worth about $182. Spreads, fees and slippage change real results, and gold can jump past a stop during news. Our lot size guide shows the same steps for other symbols.
A beginner mistake is to enter after the target is already close. With price about $14.68 from the target, a new buyer at $4,018.54 would risk $40.00 to the same stop for a smaller reward. The plan above is for the marked entry, not for chasing.
Gold Price Today and Key News
Kitco’s spot quote was $4,005.20 at 12:18 GMT+6 on 26 October. That is a small gain after Friday’s close at $3,994.90, which was a fall of 0.71% on the day. Gold also ended last week under pressure, with market reports linking the weekly loss to Middle East tension that pushed crude oil towards five-month highs.
The FWE chart price is slightly higher because it comes from a different feed and a later time. Small differences between feeds are normal, so use your own broker’s price when you place orders.
What Is Driving Gold Today
Oil and inflation. Brent crude traded above $110 earlier this month. Higher oil raises inflation risk, and that supports the case for higher interest rates. Gold pays no interest, so it usually struggles when rate expectations rise. Market reports this morning mention easing Middle East tension, which is one reason the bounce has room to continue.
Fed expectations. The Fed raised rates by 25 basis points to 3.75% to 4.00% in September. CME FedWatch pricing, as reported this morning, shows about a 90.6% chance of a hold on 28 October and about a 79.7% chance of a hike in December. Another CME-based monitor showed 89.7% for a hold on 24 October. The hold is already priced in, so the tone of the Fed chair’s press conference is the real event.
Dollar and yields. The US Dollar Index was near 101.6 on Investing.com’s data page on 26 October, little changed on the day. The US 10-year Treasury yield was about 4.98% on Monday, according to CNBC, a basis point or less lower on the day. A basis point is 0.01%. The yield fell sharply on Thursday, its biggest one-day drop in more than a year, then edged back up to about 5.00% on Friday. Gold fell 0.71% on Friday as that yield rebound and the oil rally came together, so rate and inflation worries clearly weighed that day. Do not blame every gold move on the dollar alone.
Gold Forecast Today and Gold Price Forecast This Week
Everything in this section is probability, not a promise.
Short-term bullish scenario (FWE M15 plan). Price holds above $3,996.76 on pullbacks and pushes to the recent high at $4,033.22. If it clears that high, the next reference is the $4,070 area, the old support that FWE’s 23 October analysis marked as a zone where sellers may return.
Bearish scenario. M15 candles close back under $3,996.76, then price loses $3,978.54. That ends the long idea and reopens the $3,960 to $3,941 area, where one source places the year-to-date lows. The FWE view from 23 October keeps the lower channel line near $3,750 to $3,800 as the larger target.
Additional market context. Beyond the levels on the FWE chart, Friday’s 4-hour reading was oversold according to a market report, which fits a corrective bounce. The same report places resistance at $4,070, then near $4,150 and $4,200 to $4,220. On the weekly chart, the 20-week moving average sat near $4,283 on Friday, well above price. A bounce to $4,033 does not change that bigger picture. Our swing view only turns if gold closes a daily candle above $4,200.
Gold Support and Resistance Today
| Level | Price | Source | Why it matters |
|---|---|---|---|
| Swing invalidation | Daily close above $4,200 | FWE 23 Oct analysis | Breaks the lower-high sequence. The bearish swing view is wrong above it. |
| Retest zone | $4,070 to $4,100 | FWE 23 Oct analysis, market data | Broken range floor. Sellers may return here on a stronger bounce. |
| Target and resistance | $4,033.22 | FWE chart | Recent high. Target of the M15 plan. |
| Entry | $3,996.76 | FWE chart | Base break level. A close back under it weakens the bounce. |
| Stop loss and support | $3,978.54 | FWE chart | Under the engulf candle. Close to Monday’s low of $3,977.90 (Kitco). |
| Lower support | $3,960 to $3,941 | Market data | Year-to-date lows. Own reference, not on the FWE M15 chart. |
What Changed Since the Previous Analysis
Our 23 October analysis kept a bearish view below $4,070 to $4,100, with a larger target at $3,750 to $3,800. That call has neither played out nor failed. Gold made a low near $3,975 on Friday, held above it on Monday and has bounced about $40 since. It has not reached the $4,070 retest zone, and the $4,200 invalidation level is far away.
Two things are new. Hold odds for the Fed have risen from the 84% to 87% range we quoted to about 90%. And the oil story is cooling a little today, which has helped the bounce. Our gold during FOMC plan explains how to handle the decision itself.
What to Watch Next
- Whether M15 and H1 candles keep closing above $3,996.76 into the European session.
- Reaction at $4,033.22. A clean break and hold above it would make $4,070 the next test.
- The Fed decision on 28 October at 2:00 pm New York time, which is midnight on 29 October in Bangladesh (GMT+6). Wider spreads and sudden spikes are common around it.
- Oil and Middle East headlines, plus US tech earnings on Wednesday and Thursday, which one bank says could rival the Fed for market attention.
- US PCE inflation and GDP data later this week.
We will update the levels in the next analysis. Follow the daily gold and forex updates on the Forex Wave Expert Telegram channel.
Frequently Asked Questions
Is gold going up today?
Gold is bouncing today. Kitco showed $4,005.20 (+0.26%) at 12:18 GMT+6 and the FWE chart showed $4,018.54 at 15:46 GMT+6. The bounce sits inside a bigger downtrend, so $4,070 and $4,200 matter for whether it continues.
What are the key gold levels today?
On the FWE M15 chart, support is $3,996.76 and $3,978.54, and resistance is the $4,033.22 recent high. Above that, watch $4,070. Below $3,978.54, the $3,960 to $3,941 area comes into view.
What is the gold forecast for this week?
The main event is the Fed decision on 28 October. A hold is expected, so the tone on a December hike may decide direction. A hawkish message with high oil could push gold lower. A cautious tone could extend the bounce.
What does base break entry mean on the XAUUSD chart?
A base is a tight sideways range. A base break entry means you enter when price closes outside that range. Here, an M15 bullish engulf candle closed through the base, and the stop sits below that candle.
This analysis is an opinion about probabilities, not financial advice or a signal. Gold is volatile and can move past stop levels, especially around the Fed decision. Trading carries a real risk of loss, so never risk money you cannot afford to lose.
Editorial Note: The charts and technical analysis in this post are prepared by the ForexWaveExpert (FWE) trading team. Every post is reviewed, fact-checked and corrected by Rana Das, Founder & CEO of ForexWaveExpert, a gold trader with 15+ years of experience in Elliott Wave and Price Action and winner of the Fastbull Best Mentor Award 2024. This analysis is for educational purposes only and is not financial advice.