
Gold (XAUUSD) slipped below $4,000 on 23 October 2026 and our main view is bearish while price stays under the $4,070 to $4,100 zone. The daily chart shows a falling channel, and the next target sits near the lower channel line around $3,750 to $3,800. Silver has broken a key support near $54.50 and we expect a retest before a move toward $49 to $50. For EURUSD, the analyst view is a further drop into the 1.02 to 1.055 area before a larger rally. This XAUUSD analysis explains each view, the levels, and what would prove us wrong. The Fed decision on 28 October is the next big event.
Market Context: Why Gold and Silver Are Falling
Gold fell below $4,000 in Asian trading on Friday for the first time since July. Reports point to high real yields (bond yields after inflation), a firm US dollar and expectations of more Fed tightening linked to expensive oil. Brent crude closed near $113 on Thursday after Middle East supply fears. Higher oil means higher inflation risk, and that keeps interest rates high for longer. Gold pays no interest, so it struggles when yields rise.
Gold also fell during a sharp equity sell-off. When leveraged investors need cash, they sell what they can, and gold is often sold along with stocks. This is why gold did not rise even with rising US and Iran tension. Safe-haven demand lost to the rates story.
On the Fed side, the committee raised the range by 25 basis points to 3.75% to 4.00% in September. The October meeting is on 27 and 28 October, and markets give a hold roughly 84% to 87% odds. A hike in December is still being priced in by many traders. A hold with a hawkish tone can still push gold lower.
XAUUSD Daily Chart Analysis
Chart 1 shows the daily gold chart with the current price near $4,004. Today’s range so far is about $3,987 to $4,033. The chart shows a clear downward channel that started after the January peak (above $5,400, with a spike wick near $5,600) and the March swing high near $5,400.
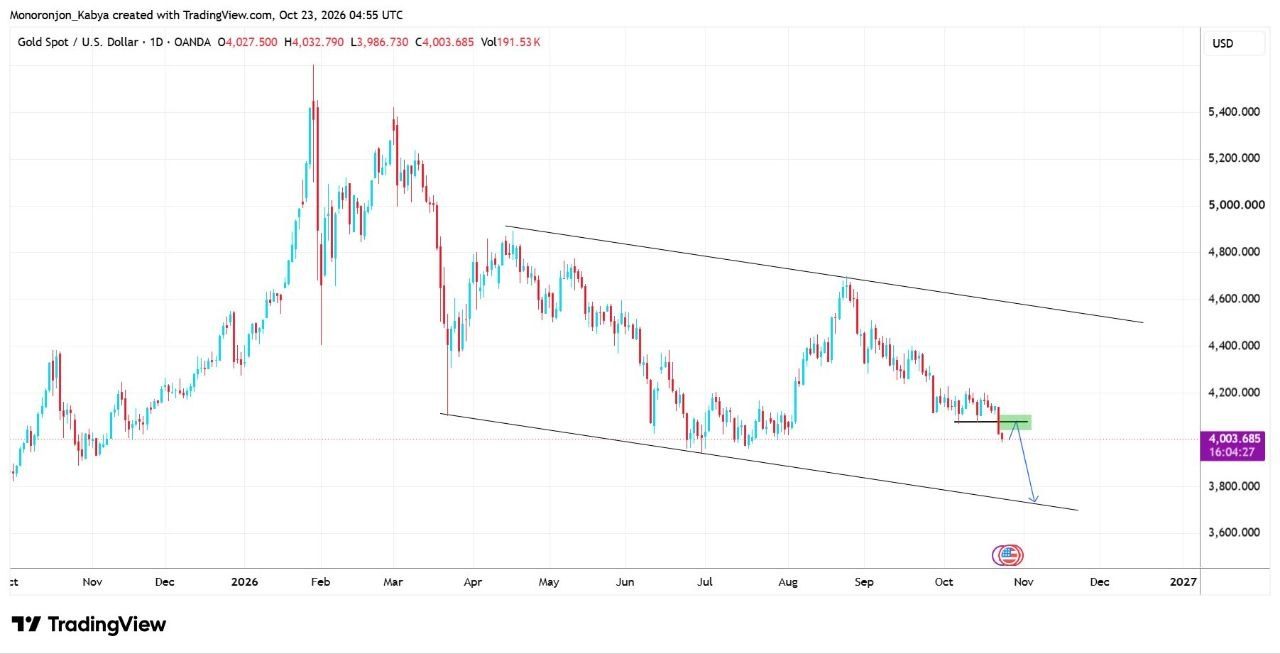
Here is what the analyst marked and why it matters:
- The channel. The upper line connects the April high near $4,900 and the August high near $4,700. The lower line connects the March low near $4,100 and the June and July lows near $3,950. Price respects both lines, so the channel is a fair guide for direction.
- The breakdown level. The black line near $4,070 was the floor of the October range. Price broke it on 22 October. Other sources also flag the $4,065 to $4,070 area as old support that now acts as resistance.
- The retest zone. The green box between roughly $4,070 and $4,100 is where we expect sellers to return. The blue arrow shows a pullback into this zone and then a fall toward the lower channel line, near $3,750 in early November.
This is a method many beginners skip. They sell after the breakdown candle at the lowest price. Experienced traders wait for the retest, because the stop loss can sit just above the zone and the risk is smaller.
Bigger Picture on Gold
Chart 2 has no analyst note, so here is my own read. It zooms out to show the rally from near $3,000 in April 2025 to the January 2026 peak. The decline since then looks like a correction inside that larger rally, not yet a collapse.
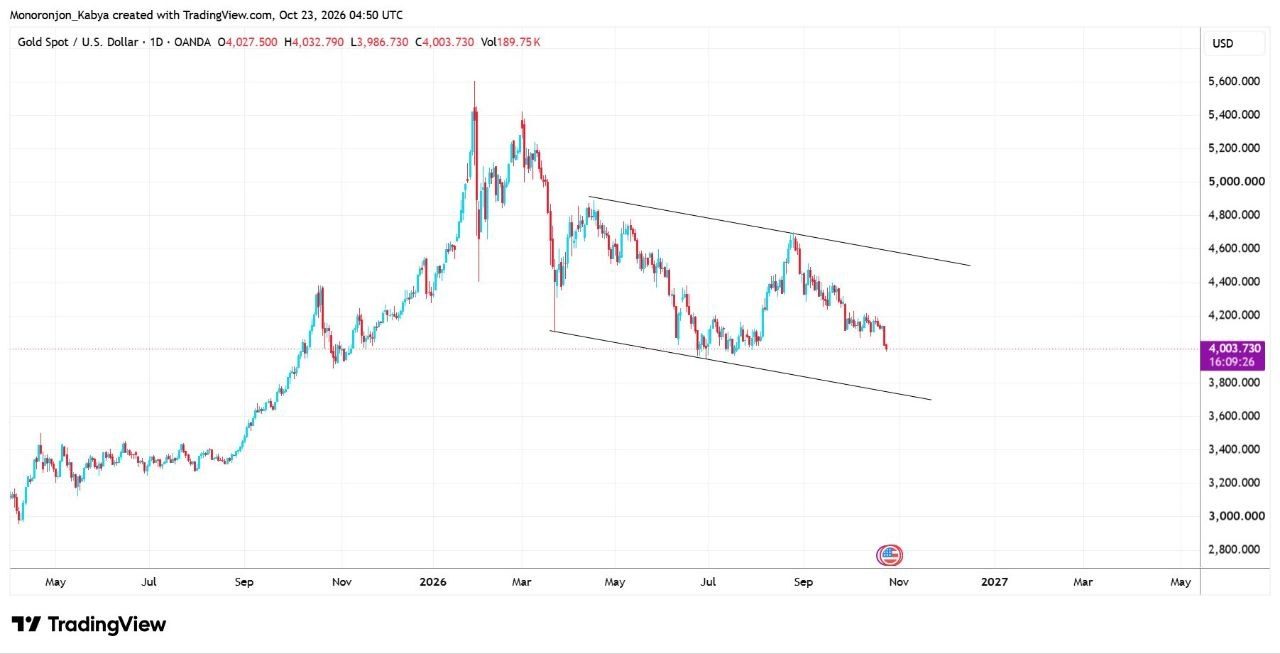
Two things stand out. First, the area around $3,950 to $4,000 is close to the 61.8% Fibonacci retracement of the whole 2025 to 2026 rally (my rough reading, from about $2,950 to $5,600). Traders watch this level, and it lines up with the June and July lows. A bounce here is possible. A clean daily close below it would open the way to the lower channel line. Second, the long sideways base between $3,250 and $3,450 in mid 2025 is the deeper support if the channel breaks. That is a long way down, about $550 or more below today’s price, so I would treat it as a far scenario only.
Gold Key Levels
| Level | Price | Why it matters |
|---|---|---|
| Resistance | $4,200 | Recoveries in October stalled here. Buyers need this back to ease the pressure. |
| Retest zone | $4,070 to $4,100 | Broken range floor. Preferred area to look for sells. |
| Pivot | $4,000 | Psychological level. Daily close below it keeps sellers in control. |
| Support 1 | $3,950 to $3,960 | June and July lows, near the 61.8% retracement. |
| Target | $3,750 to $3,800 | Lower channel line in early November. |
| Invalidation | Daily close above $4,200 | Breaks the October lower-high sequence and reopens $4,350 and higher. |
Gold Scenarios
Bearish (our main view). Price pulls back into $4,070 to $4,100, fails, and falls through $4,000 and $3,950 toward $3,750 to $3,800. Oil staying high and a hawkish Fed would support this path.
Bullish. Gold holds $3,950 to $4,000, reclaims $4,100 and then $4,200. That would turn the move into a bounce inside the channel, with the upper line far above, near $4,500 and higher. A hold at the Fed with softer language, or a drop in oil and yields, could start this.
Our view changes if gold closes a daily candle above $4,200. At that point the retest idea is wrong and we step aside.
Worked Example: Sizing a Gold Sell From the Retest
Say your account is $10,000 and you risk 1%, which is $100. You plan to sell at $4,070 with a stop loss at $4,110, so the stop is $40 away. One standard lot of gold is 100 ounces, so a $1 move equals $100 per lot. A $40 stop on one lot loses $4,000. For a $100 risk, divide: $100 / $4,000 = 0.025 lot, so use 0.02 lot (risk about $80). If the first target is $3,900, the reward is $170 against $40 risk, a ratio of about 4.25 to 1. Gold can move $40 in minutes during news, so allow for spread and slippage. Our lot size guide shows the same steps for other symbols.
XAGUSD (Silver) Analysis: Daily and 4 Hour
Silver is trading near $54.35, down from a peak around $120 in late January. News sources report silver at a seven-month low today. The gold to silver ratio is about 74 ($4,004 divided by $54.34), so silver is falling at least as fast as gold.
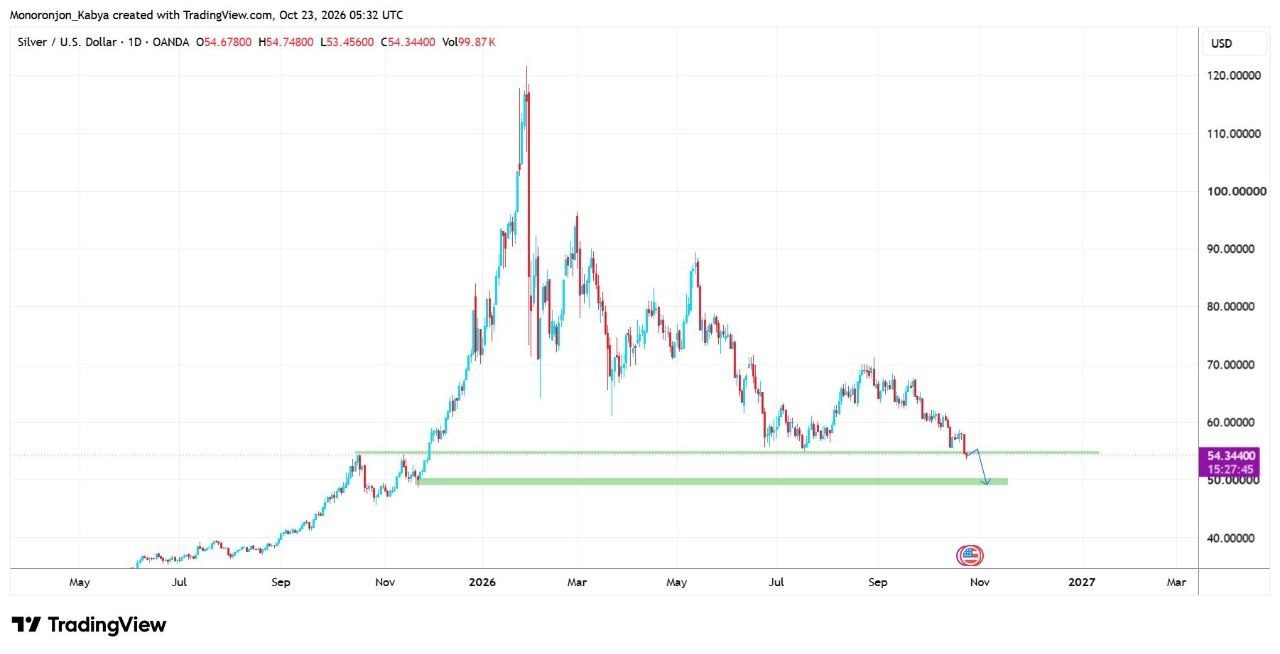
Chart 3 (daily) shows the horizontal support near $54.50 to $55. This level matters because it holds the June and July 2026 lows and also the highs from October and November 2025, when silver was breaking out. Price has now closed below it. The analyst expects a small retest from below, then a drop into the lower green zone, roughly $48.50 to $50. That zone is the base of the November and December 2025 move, before the big rally started.
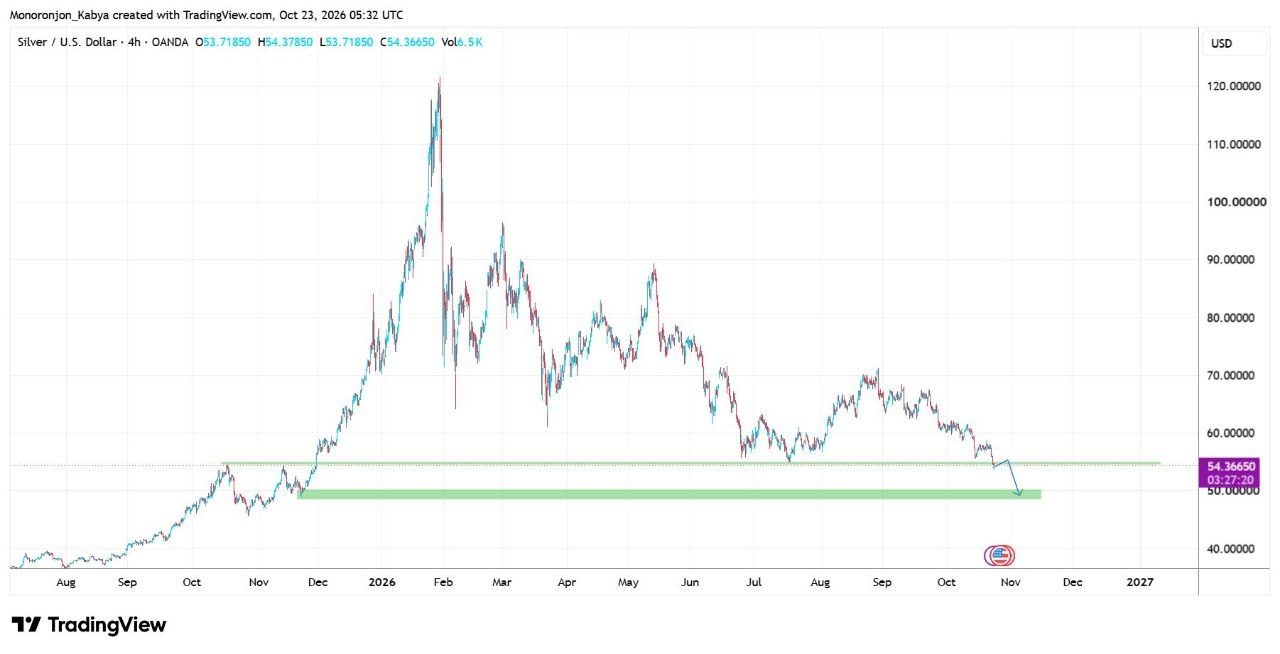
Chart 4 (4 hour) gives the same story in more detail. Price has pushed under the line, and the arrow shows a weak bounce, a rejection near $54.50 to $55.50, and then a move down. For entries, the 4 hour chart is useful because you can wait for a bearish candle at the retest and place the stop above $56.
| Level | Price | Why it matters |
|---|---|---|
| Resistance | $57 to $58 | Last bounce high before the break. Daily close above $58 invalidates the view. |
| Retest zone | $54.50 to $55.50 | Broken support. Look for rejection here. |
| Today’s low | $53.46 | First level sellers have to hold below. |
| Target zone | $48.50 to $50 | Base from late 2025, also a round number area. |
Bullish scenario: silver reclaims $55.50 and holds above it, which means the break was a false one. That would target $57 to $58. Bearish scenario: a failed retest and a push through $53.46 toward $50. Silver moves faster than gold, so use a smaller lot size on silver than you would on gold for the same dollar risk.
EURUSD Analysis: Daily Chart
EURUSD is near 1.1212. On 14 October it touched about 1.1114, which one broker report calls a 17-month low. Since 19 October the pair has stayed in a tight band, roughly 1.1180 to 1.1260. The daily chart (Chart 5) shows a lower high near 1.17 and then a steady decline.
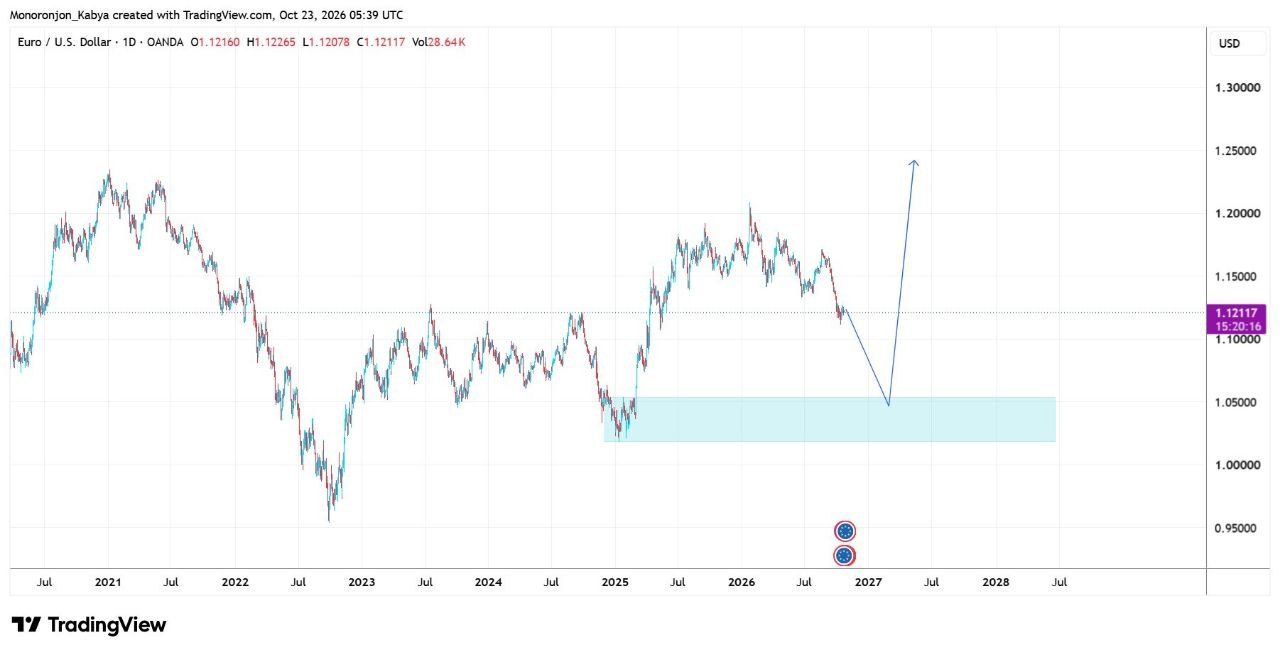
The analyst view is that the euro has more downside first. The blue box on the chart, around 1.02 to 1.055, is the 2025 base where EURUSD turned up before the large rally to the early 2026 high near 1.21. The arrow shows a fall into that box, then a strong recovery toward about 1.24, close to the 2021 high. That is a swing idea over months, not days. The drop to 1.05 would be around 700 pips from here.
The fundamentals support the dollar side for now. French bond stress is large, with the French 10-year yield premium over Germany at 175 basis points and the French 10-year yield above 5%. Eurozone consumer confidence fell to -17.9 in October. The US 10-year yield is near 5.06% and the dollar index is around 101.85.
The risk to this view is real. The IMF has said the ECB may need to raise rates by at least another 25 basis points, and eurozone inflation was reported at 3.8%. A hawkish ECB on 29 October could support the euro. Also, markets expect the Fed to hold on 28 October, and a softer Fed could weaken the dollar quickly.
| Level | Price | Why it matters |
|---|---|---|
| Invalidation | 1.1700 | Last major lower high. A daily close above it breaks the downtrend. |
| Range top | 1.1250 to 1.1260 | Top of the October range. |
| Recent low | 1.1114 | 14 October low. A close below opens the way lower. |
| Downside zone | 1.0200 to 1.0550 | 2025 base and the analyst’s target area. |
| Long-term target | 1.2400 | Analyst’s rally target after the low forms, near the 2021 high. |
On EURUSD I would not chase a short after a 17-month low has already formed. Wait for a lower-time-frame rejection near 1.1250 and keep the stop above the range top. For a long, wait for a clear reversal inside the blue zone, not before.
What to Watch Next
- 27 to 28 October: FOMC meeting. The decision and statement come on 28 October at 2:00 PM ET, followed by the press conference. There is no dot plot at this meeting.
- 29 October: ECB decision and US PCE inflation data (the Fed’s preferred inflation measure).
- 6 November: US jobs report, then US CPI on 10 November.
- Oil and Treasury yields: both have driven gold this month. A drop in oil would ease pressure on gold.
Fed week is dangerous for small accounts. If you are on a prop firm challenge, check your daily loss limit and consider no new trades 30 minutes before and after the decision. Our guide on how to trade gold during FOMC has a practical plan.
Forex Wave Expert’s position on Bangladesh is clear. Under the Foreign Exchange Regulation Act 1947, and Bangladesh Bank warnings against online forex trading, sending money abroad to a forex broker from Bangladesh is illegal. We do not encourage any Bangladeshi to invest with a forex broker. Many IBs (introducing brokers) push people to deposit only to earn commission, and people lose money this way. The path we support is to learn properly, pass a prop firm challenge, and bring the payout into Bangladesh through the bank as remittance. Keep your payout documents and follow the bank’s process. Read more in our guide on বাংলাদেশে ফরেক্স ট্রেডিং বৈধ কিনা.
We share daily gold and forex updates on the Forex Wave Expert Telegram channel. You can also read more about the author on the Rana Das profile page.
Frequently Asked Questions
Why is gold falling today?
Gold is under pressure from high oil prices, high US Treasury yields, a firm dollar and expectations of another Fed rate hike in December. Gold also got sold during a stock market sell-off as investors raised cash.
What is the next support for XAUUSD?
The first support is $3,950 to $3,960, near the June and July lows. Below that, our target is the lower channel line near $3,750 to $3,800. These are probability levels, not guarantees.
Will the Fed raise rates on 28 October 2026?
Markets give a hold about 84% to 87% odds, with a hike in December still priced by many traders. The decision is released at 2:00 PM ET. Prices can move sharply either way, so reduce size or stay out of the first minutes.
Is gold a buy below $4,000?
The trend on the daily chart is down, so we prefer to wait. A buy idea needs a clear reclaim of $4,100 and then $4,200. Trying to catch the bottom without a reversal signal is a common reason accounts fail.
What is the silver price target after the support break?
Our target zone is $48.50 to $50 after a possible retest of $54.50 to $55.50. A daily close above $58 would cancel this view.
This analysis is an opinion about probabilities, not financial advice or a signal. Gold, silver and forex are volatile and leveraged, and you can lose more than you expect. Use a stop loss, risk a small percentage per trade and never trade money you cannot afford to lose.