
Impulse Wave Rules and Guidelines: The Power of Elliott Waves (Part 7)
Impulse Wave Rules and Guidelines: Unlocking Elliott Wave Patterns – Extension, Truncation, and Fibonacci Precision.
**Introduction:**
Elliott Wave Theory, a cornerstone of technical analysis, stands as a powerful tool in the financial world, aiding traders and analysts in deciphering market trends and potential reversals. In this comprehensive Impulse Wave Rules and Guidelines, we delve into the intricacies of Elliott Wave 3 extension, Wave 5 impulse truncation, and the guiding principles of impulse movements. We will also explore the pivotal role of Fibonacci percentage calculation in refining Elliott Wave analysis.
 **Elliott Wave 3 Extension:**
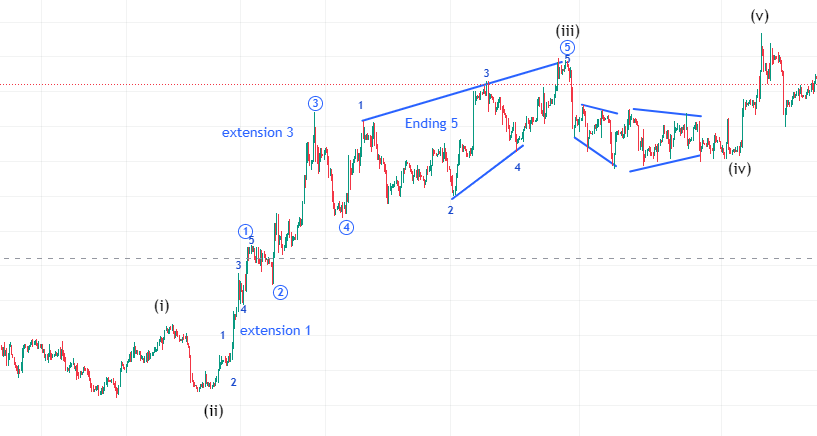
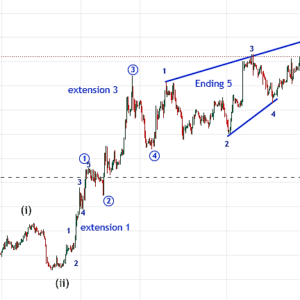
Elliott Wave 3 extension unfolds when the third wave within an impulse movement lingers for an extended period, deviating from the conventional 1-2-3-4-5 sequence. Wave 3 extension involves the emergence of additional sub-waves within the overarching Wave 3. This extension introduces a complexity that goes beyond the typical five-wave structure, with the pattern evolving into 1-2-3-4-5-1-2-3-4-5. Each of these sub-waves represents a distinct price movement within the larger bullish trend, signifying a sustained and robust market sentiment.
To illustrate, let’s consider a practical example involving Stock ABC. In an uptrend, if Wave 3 extends, the usual 1-2-3-4-5 sequence transforms into a more intricate pattern. Traders observing this extension might anticipate an elongated bullish phase, as manifested by the prolonged duration and additional sub-waves within Wave 3.
 **Wave 5 Impulse Truncation:**
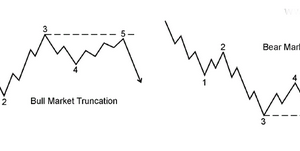
Wave 5 impulse truncation presents itself when Wave 5 fails to surpass the price level set by Wave 3. This pattern often acts as a precursor to a market reversal, alerting traders to potential shifts in trend direction. Traders keenly observe Wave 5 truncation as it signifies an inability to breach the peak established by Wave 3, suggesting a loss of momentum in the prevailing trend.
Imagine you’re tracking the exchange rate of a hypothetical currency pair, like USD/CAD. Now, during a period of rising prices (a bullish trend), there’s a specific pattern we should pay attention to.
If the fifth upward movement, known as Wave 5, doesn’t manage to go higher than the price reached by the third upward movement, called Wave 3, it could be a signal. For instance, let’s say Wave 5 peaks at $1.4689 instead of surpassing the highest point of Wave 3 at $1.4708.
In simpler terms, this situation is called a truncation. It’s like the market hits a ceiling and can’t go as high as it did before. This truncated fifth wave acts like an early warning for traders. It suggests they should rethink their strategies, consider reassessing their current positions, and even get ready for a potential change in the trend—a reversal.
**Impulse Wave Rules and Guidelines:**
Traders must adhere to specific rules and guidelines for effectively navigating Elliott Waves. These rules are integral to maintaining the structure and predictability of impulse movements. Key principles include the formation of sub-waves or extensions in Waves 1, 3, and 5, along with constraints on retracements and overlap between Waves 1 and 4.
Imagine tracking the price of Gold using Elliott Wave principles in an upward trend:
- Wave 1: Gold starts moving up, forming a pattern with five smaller waves.
- Wave 2 Retracement: There’s a small pullback, a brief pause before the next move.
- Wave 3 Extension: The real action happens here. Wave 3 extends, creating more complexity.
Think of these waves as building blocks. Each wave builds on the previous ones, forming a clear and predictable sequence. Following these rules is like having a roadmap for understanding and interpreting Gold’s price movements accurately.
In simpler terms, it’s like watching a series of steps unfold, helping traders navigate and make informed decisions in the dynamic world of Gold prices.
**Fibonacci Percentage Calculation:**
Adding to the precision of Elliott Wave analysis is the integration of Fibonacci percentage calculation. Traders often leverage Fibonacci retracement and extension levels to identify potential reversal points and project target levels for Waves 3 and 5.
During Wave 2 retracement, Fibonacci retracement tools come into play. Suppose a stock, XYZ Inc., experiences a corrective Wave 2 retracement, declining from $100 to $80. Traders can utilize Fibonacci retracement levels (38.2%, 50%, and 61.8%) to identify potential reversal levels. If the stock bounces back from the $88 level, it could be seen as finding support at the 61.8% Fibonacci retracement level.
Additionally, Fibonacci extension levels, such as 127.2%, 161.8%, and 261.8%, play a crucial role in projecting termination points for Waves 3 and 5. These levels provide traders with valuable insights into potential price targets and turning points, aiding in strategic decision-making.
**Practical Example: Applying the Knowledge in a Real Scenario**
To strengthen our grasp of these concepts, let’s delve into a tangible scenario. Imagine we are analyzing the price movements of Company XYZ’s stock. After identifying a potential Elliott Wave 3 extension, we observe the following sub-wave pattern: 1-2-3-4-5-1-2-3-4-5. This complexity within Wave 3 signals a prolonged bullish momentum.
 Now, let’s apply Fibonacci analysis.
Imagine you’re tracking Company XYZ’s stock. When it corrects from $100 to $80 (Wave 2 retracement), Fibonacci analysis comes into play.
- Decline: Stock drops from $100 to $80.
- Fibonacci Levels: Fibonacci retracement looks at levels like 38.2%, 50%, 61.8% or 78.6% of the decline.
- Support Identification: If the stock bounces back, especially from $88, it finds support at the 61.8% Fibonacci level.
In a nutshell, Fibonacci helps identify potential bounce-back points during corrective phases, aiding traders in decision-making.
This practical example demonstrates how the integration of Elliott Wave principles and Fibonacci analysis can provide valuable insights for traders, aiding in decision-making and strategy formulation.
**Conclusion:**
In conclusion of Impulse Wave Rules and Guidelines, the marriage of Elliott Wave principles with Fibonacci percentage calculation enhances the accuracy of market analysis. This comprehensive approach, combining insights from an understanding of Wave 3 extension, Wave 5 impulse truncation, and adherence to impulse rules, equips traders with a robust framework for navigating the dynamic landscape of financial markets. Stay tuned for more practical applications as we continue to unravel the complexities of Elliott Wave Theory in our learning series.
Add a Comment
You must be logged in to post a comment