
Gold technical analysis today puts XAUUSD near 4036, sitting on a small demand zone after the Fed held rates. The 3975 low is the level that matters most. We favour a bounce to the top of the falling channel around 4100-4110. Treat it as a bounce inside a bigger downtrend, not a change of trend. A close below 3975 cancels the idea.
Gold Today at a Glance
- Gold price: near 4036, down about 0.5% on Wednesday and little changed in early trade today.
- Main news: the Fed held at 3.75% to 4.00%, with Cook and Hammack dissenting in favour of a hike. Warsh left December open. Oil is high, and today’s US releases include the advance Q3 GDP estimate and September PCE inflation.
- Our bias: bullish bounce toward 4100-4110 while price holds above 3975. The larger trend is still down.
- Support: 4022-4030, then 3980-4000.
- Resistance: 4079-4083, then 4100-4120.
Gold Technical Analysis Today: Bounce Within a Downtrend
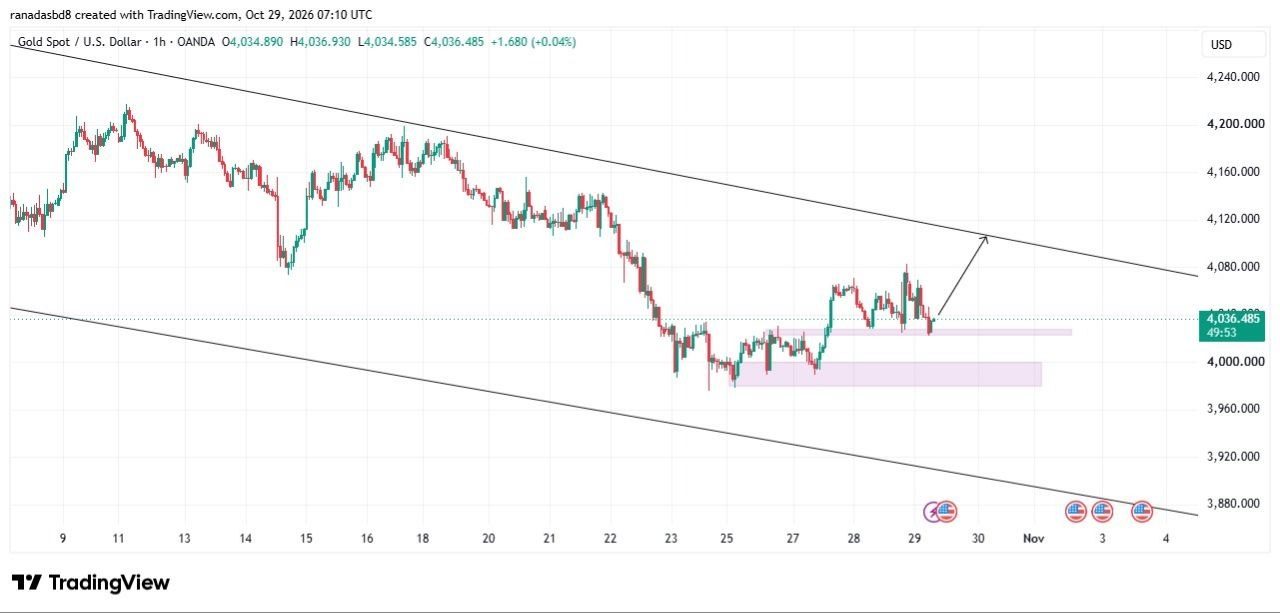
On the 1 hour chart, gold climbed to about 4080 on Wednesday, could not hold it and slid back into a thin demand strip at 4022-4030. We expect a bounce from that strip to the channel top near 4105-4110. A larger demand box at 3980-4000 sits underneath, just above the 3975 low.
On the 2 hour chart, gold has been falling inside a descending channel since the early September high near 4500, and each rally has ended at a lower high. We see two possible paths. A bounce toward 4100 could lead to a brief pullback before a break toward 4220-4240. If demand gives way, the alternative is a drop toward 3870-3880 before a recovery toward 4110-4120.
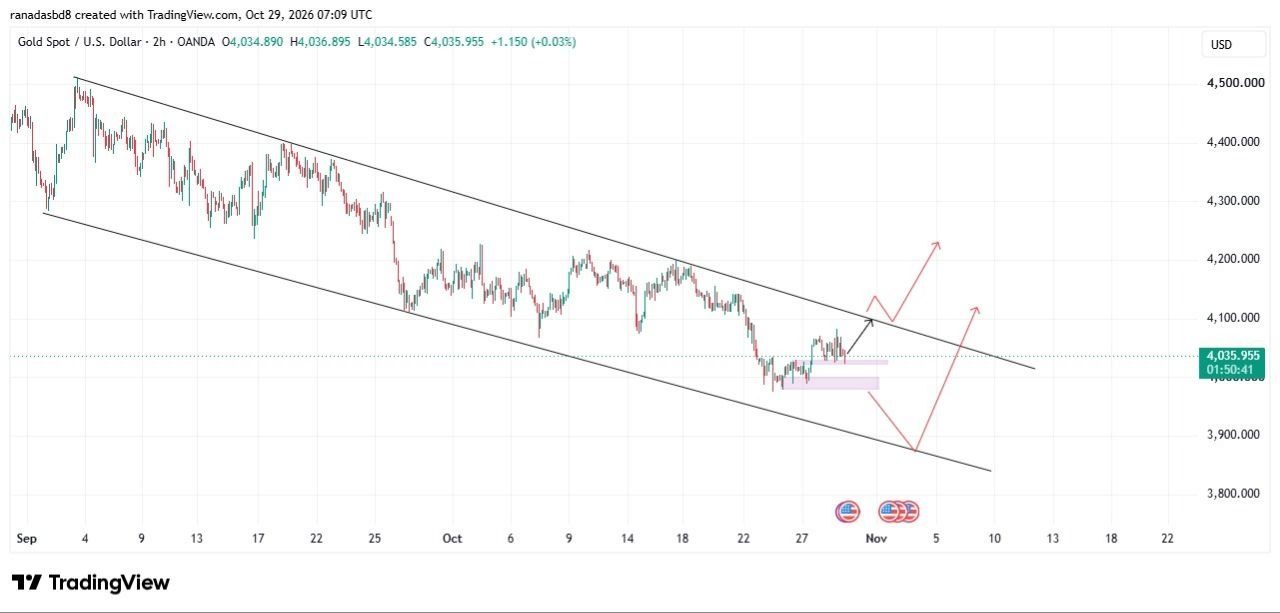
Neither recovery is guaranteed. The deeper route would invalidate the current bounce trade before any recovery. Keep the bounce stop below 3975; the deeper setup needs separate confirmation.
Why 4100-4125 Could Cap the Bounce
On the daily chart, gold still trades below its 50, 100 and 200 day averages. The 20 day EMA (exponential moving average) also puts resistance near 4120. The channel top, nearby resistance and the 20 day EMA cluster around this area, so we expect sellers around 4100-4125. A daily close above 4120 would be the first real sign the recovery has more room.
Below price, the levels to know are 4015, last Friday’s low at 3975 and the year to date low near 3941.
Why Gold Is Under Pressure
The Fed. The Fed held rates at 3.75% to 4.00%, with Cook and Hammack dissenting in favour of a hike. Warsh left December open, and CME FedWatch still shows a high chance of a December hike. Gold did not break much lower on a hold with two hawkish dissents, which is a mildly encouraging sign for buyers.
Dollar and yields. The US Dollar Index is holding near 102 and the 10 year Treasury yield is close to 5.0%. Neither gives gold much help right now.
Oil and the Middle East. Brent is near 115 after Yemen’s Houthis claimed an attack on Saudi Arabia’s Ras Tanura refinery. Saudi authorities had not confirmed the strike in the reports we saw. Higher oil prices are adding to inflation concerns and expectations of another rate hike. Tensions between the US and Iran may offer gold some support.
Data today. Today’s US releases include the advance Q3 GDP estimate and September PCE inflation, both due at 12:30 GMT. A hot PCE number would raise December hike odds and could push gold toward 4015.
Gold Price Prediction Today: Scenarios
- Bullish (our preferred view): gold holds 4022-4030, clears Wednesday’s high near 4080 and presses toward 4100-4120. We expect sellers there. A close above 4120 would open 4160-4190.
- Pullback first: a 2 hour close below 4015 puts the 3980-4000 demand zone in focus. The current bounce setup remains valid while 3975 holds. The deeper route toward 3870-3880 is a separate scenario.
- Invalidation: a 2 hour close below 3975. The bounce view is off, 3941 comes into focus, and the lower channel near 3870-3880 is the next marked area.
Watch for a close above 4079-4083, with US data and oil prices likely to influence the reaction. Watch December hike expectations as well; a further rise could put more pressure on gold.
Gold Support and Resistance Today
| Level | Price | Source | Why it matters |
|---|---|---|---|
| Channel top and supply | 4100-4120 | FWE chart | Target of the bounce. Sellers may return here. |
| Wednesday high | 4079-4083 | Market data | First hurdle. Sits inside the 4079-4103 resistance zone. |
| Thin demand strip | 4022-4030 | FWE chart | Initial demand zone. |
| Minor support | 4015 | Market data | A 2 hour close below it would put 3980-4000 in focus. |
| Demand box | 3980-4000 | FWE chart | Second line for buyers. |
| Last Friday’s low | 3975 | Market data | A close below cancels the bounce view. |
| Year to date low | 3941 | Market data | Next support if 3975 breaks. |
| Lower channel line | 3870-3880 | FWE chart | End point of the deeper route. |
Treat these zones as approximate areas, not exact prices.
What Changed Since Yesterday
In yesterday’s FOMC analysis, we kept a bullish view while 3975 held and named 4105-4120 as the target. The first half worked. Gold held above the low and rose to about 4080, but it stopped short of the supply area and gave back the gains after the Fed. The hawkish path we flagged, a drop through demand into 3990-4010, has not happened. Our focus now shifts from the 2 hour zone to the thin strip at 4022-4030. The bounce looks a little weaker than we hoped.
How to Trade It Safely on a Data Day
Spreads widen around PCE and GDP. Cut your size, or wait until the first few 15 minute candles settle, and do not chase the first spike. If you trade the bounce, put the stop beyond 3975 and size the trade so a stopped out trade costs 1% of the account or less. Our lot size guide shows how to work that out, and our plan for trading gold around Fed events covers the news side. Prop firm traders should read the news trading rules before holding anything through the data. Follow daily gold updates on the FWE Telegram channel.
Frequently Asked Questions
Is gold going up today?
Gold is near 4036, and we favour a bounce toward 4100-4110 while price holds above 3975. The bigger trend is still down, so sellers may return around 4100-4125. Today’s GDP and PCE data could move gold fast in either direction.
What is the gold price prediction today?
We favour a bounce toward 4100-4120 while 3975 holds. The larger trend is still down.
Why is gold under pressure after the Fed?
The Fed held rates, but two officials wanted a hike, and markets still price a high chance of a December increase. Oil near 115 adds to inflation concerns. Higher rate expectations tend to weigh on gold, though yields alone do not explain every move.
Should I trade gold during GDP and PCE releases?
It is riskier than usual. Spreads widen and price can spike both ways within seconds. If you trade, cut your position size, keep a stop loss and consider waiting for the first few candles to settle. Prop firm traders should check their firm’s news rules first.
Trading gold and other CFDs involves a high risk of loss. This analysis is an opinion about probabilities, not financial advice or a signal. Spreads, slippage and news can change results quickly, so use a stop loss and risk only what you can afford to lose.
Editorial Note: The charts and technical analysis in this post are prepared by the ForexWaveExpert (FWE) trading team. Every post is reviewed, fact-checked and corrected by Rana Das, Founder & CEO of ForexWaveExpert, a gold trader with 15+ years of experience in Elliott Wave and Price Action and winner of the Fastbull Best Mentor Award 2024. This analysis is for educational purposes only and is not financial advice.