**End of Elliott Wave 5: Understanding Elliott Wave Mastering
**Introduction:**
In this article, we will delve into various techniques to understand the End of Elliott Wave 5, a crucial aspect of wave theory. The methods outlined below incorporate both technical analysis and practical approaches to provide a comprehensive understanding of how to identify the end of the fifth wave.
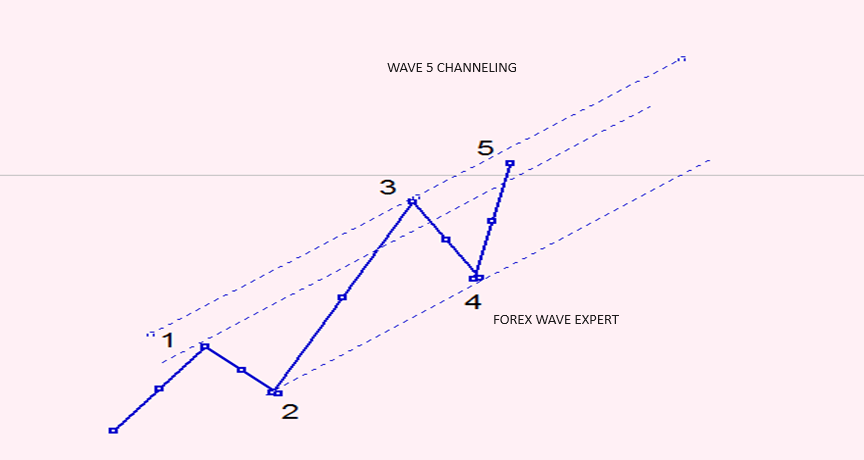
1. Channeling Technique for Wave 5: To figure out End of Elliott Wave 5, we use something called channeling. Here’s how:
Image 1: Connect the lines from Waves 1, 2, and 4 to make a channel.
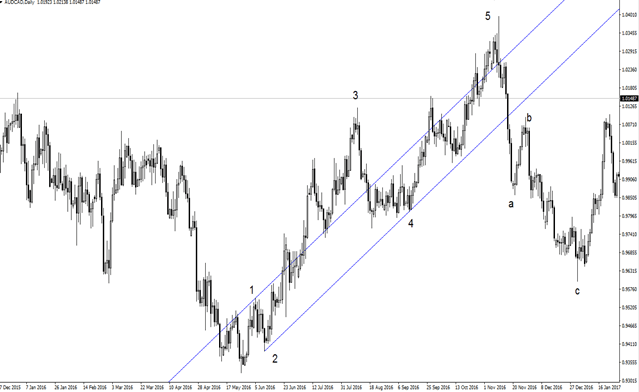
Image 2: Make a copy of Channel 1 and start it where Wave 1 begins.
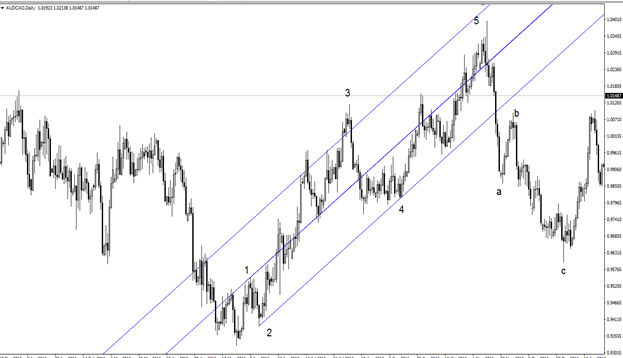
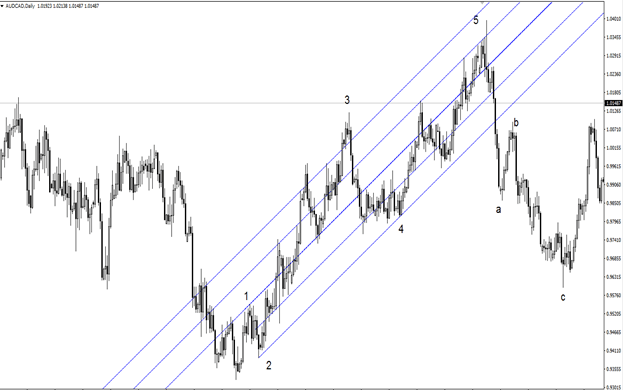
Image 3: Copy Channels 2 and 3 and put them between Waves 2 and 3. Usually, Wave 5 finishes somewhere between Waves 1 and 3.
Now, let’s simplify the explanation:
Wave 5 usually ends within the lines we drew connecting Waves 1, 2, and 4. This method helps us guess where Wave 5 might stop.
- Image 1: Shows how to connect the lines from Waves 1, 2, and 4.
- Image 2: Demonstrates making a copy of Channel 1 and starting it where Wave 1 begins.
- Image 3: Illustrates copying Channels 2 and 3 and placing them between Waves 2 and 3. Usually, Wave 5 finishes between Waves 1 and 3.
Knowing this helps traders make smart decisions when using Elliott Wave analysis.
2. Fibonacci Expansion for Wave 5 and Sub-Wave Price Levels: Understanding how to use Fibonacci Expansion is crucial for predicting the end of Wave 5. This technique is straightforward and can be mastered through practice. Let’s break it down:
In the accompanying illustration, I’m showing you how to set up Fibonacci Expansion for accurate predictions:
Image 1: To initiate Fibonacci Expansion, start by connecting the beginning of Wave 1 to the end of Wave 3. Next, connect the end of Wave 3 to the end of Wave 4. This process helps us project potential termination points for Wave 5 accurately.
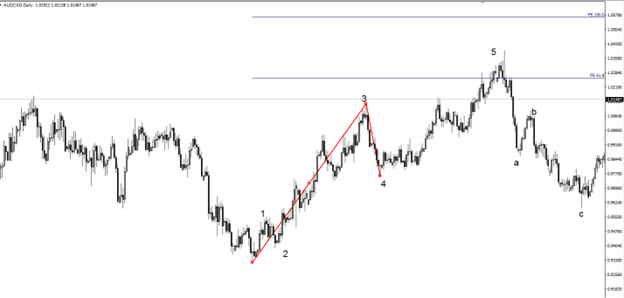
Image 2: After setting up Fibonacci Expansion, it’s essential to note that Wave 5 can conclude within the range of 50%-61.8%. In the case of an extended wave, it may even reach up to 161.8%. Real-time market observations are crucial since Wave 5 often completes before reaching 61.8%. Also, keep in mind that Sub-Wave 3-4-5 can sometimes occur independently of the main Wave without strictly following the main Wave 1-5 sequence.
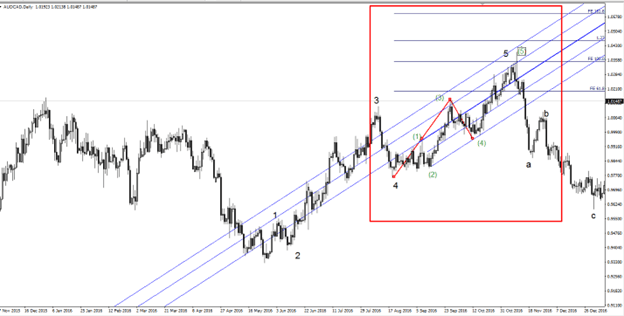
Image 3-4-5: Setting up Fibonacci Expansion for Wave 5 Projections
In this example, we illustrate the step-by-step process of configuring Fibonacci Expansion to project potential termination points for Wave 5. By connecting specific waves, traders gain valuable insights for making informed predictions in Elliott Wave analysis.
Image 1: Projecting wave 3.

Image 2: Projecting wave 5.

3. Divergence and Momentum Shift from Wave 3 to 5:
When exploring Wave 5 and its potential termination, MACD (Moving Average Convergence Divergence) becomes a valuable tool, particularly for identifying divergence between Waves 3 and 5.
Here are the steps to carefully observe when seeking MACD divergence:

Identify Wave 3: Look for the initiation of Wave 3 in your Elliott Wave sequence.
Observe Wave 4 Movement: As Wave 4 unfolds and completes its correction, take note of its termination.
Utilize Default or Common MACD Settings (e.g., 5-34-35): MACD settings like 5-34-35 are commonly used in Elliott Wave analysis.
Exercise Caution during Divergence Identification:
Confirm Wave 3: Make sure Wave 3 is accurately identified in your analysis.
Wave 4 Completion: Ensure Wave 4 has completed its movement and correction.
Watch MACD Histogram: Examine the MACD histogram, aiming for a scenario where it has fewer than five bars. This observation is critical in identifying divergence effectively.
While employing MACD for divergence analysis, it’s crucial to note that both regular and exaggerated divergence patterns can be effective in predicting Wave 5 ends. However, exaggerated divergence often proves to be more reliable for anticipating the conclusion of Wave 5.
By incorporating MACD divergence insights into your analysis, you enhance your ability to make informed projections during Elliott Wave 5 analysis, thereby strengthening your overall trading strategy.
**4. Reversal Chart Patterns:**
Identify reversal patterns such as Rising or Falling Wedges (Diagonal Triangles), trendline breaks, Double or Triple Tops, and 1-2-3 Tops or Bottoms as potential indications of the end of Wave 5.
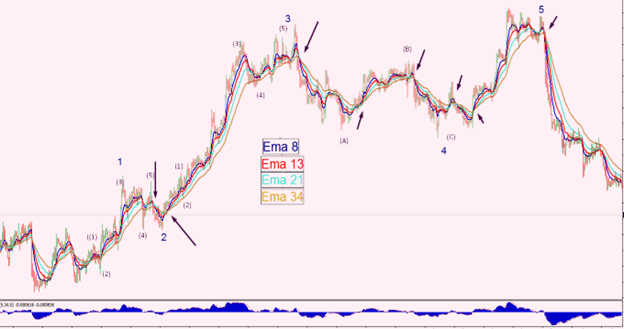
**5. Daily EMA (Exponential Moving Average) Analysis – 8-13-21 and 34:**
Employing EMA crossovers, especially the 8-13-21, and 34 EMA, helps discern trends and potential changes in the market. Pay attention to EMA crosses during each wave and sub-wave for trend confirmation.
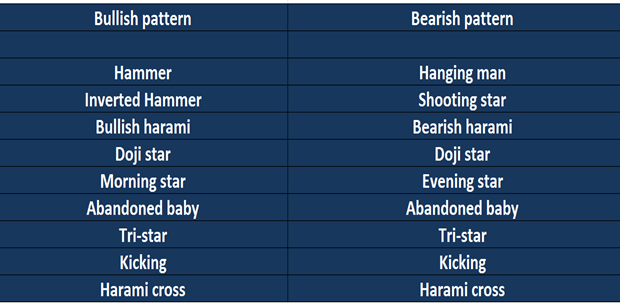
**6. Candlestick Reversal Patterns:**
Study candlestick patterns for a more refined analysis of potential reversals. Some candlestick reversal patterns included in this image.
**Conclusion:**
By incorporating these six techniques, you can develop a holistic understanding of how to identify the conclusion of Elliott Wave 5. It is essential to use a combination of these methods, as relying solely on one may not be effective in all market conditions. Continuously practice and observe the market to enhance your skills in recognizing these patterns and making informed trading decisions. !
#elliott wave, #leading diagonal, #elliott wave theory

Add a Comment
You must be logged in to post a comment