
Gold chart analysis
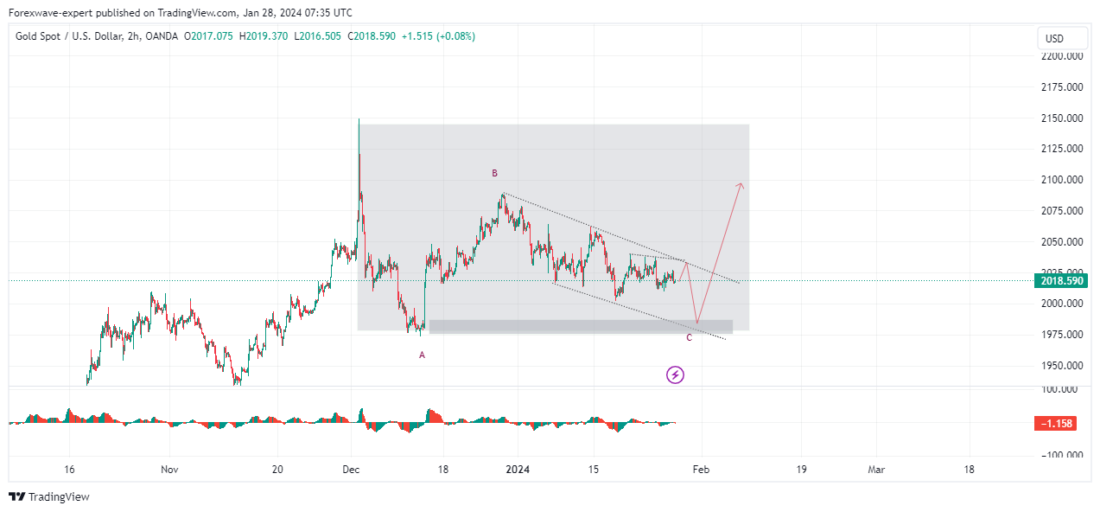
As per My Gold chart analysis From the period of 2036 to 2040, the gold price has formed a liquidity zone and a price trend line. There is a possibility of increased optimism in the demand zone below the trend line.
If gold remains over the trend line and corrects downwards, it may come down. Currently, retail sellers are actively participating in the gold market. However, to give more strength to the uptrend, it needs to break above the 2040 level.
I will attempt to capture a significant upward movement from below, waiting for a larger buy movement. In the provided chart, I observe a flat pattern (3-3-5) in the box, and if a C-wave structure forms, a long-term buy move can be expected.
It’s important to note that this analysis is not a 100% prediction, but it outlines my plan for trading gold. I will post this gold technical analysis on my website and emphasize that trading is never guaranteed, and it’s just my approach to trading gold.
For chart analysis you can check our daily analysis page and intraday analysis page. also can follow us on telegram.
Add a Comment
You must be logged in to post a comment