
Mastering MACD: A Comprehensive Guide to Understanding and Using MACD Indicator for Successful Trading.
Introduction:
The financial markets are a dynamic landscape where traders rely on various tools to make informed decisions. Among these tools, the Moving Average Convergence Divergence (MACD) indicator has emerged as a powerful ally for technical analysis. In this article, we will explore the MACD indicator, covering its history, functionality, and how beginners can harness its capabilities. Additionally, we’ll delve into the intriguing concept of MACD divergence, examining regular, hidden, and exaggerated divergences.
Understanding MACD:
Developed by Gerald Appel in the late 1970s, the MACD indicator is a trend-following momentum indicator that aids traders in identifying potential trend reversals, gauging momentum strength, and determining the overall direction of a security’s price. Comprising the MACD line, Signal line, and a histogram, MACD offers a visual representation of the divergence between two exponential moving averages (EMAs).
Components :
The MACD line is derived by subtracting the 26-period EMA from the 12-period EMA, while the Signal line represents a 9-period EMA of the MACD line. The histogram visually displays the difference between the MACD line and the Signal line.
How to Use:
Traders leverage MACD for various purposes, such as identifying potential trend reversals and determining the strength of a trend. A bullish signal is generated when the MACD line crosses above the Signal line, indicating a potential upward price movement. Conversely, a bearish signal occurs when the MACD line crosses below the Signal line, signaling a possible downward trend.
Divergence:
Divergence is a critical aspect of MACD analysis, and it comes in three main forms: regular, hidden, and exaggerated.
 1. Regular Divergence:
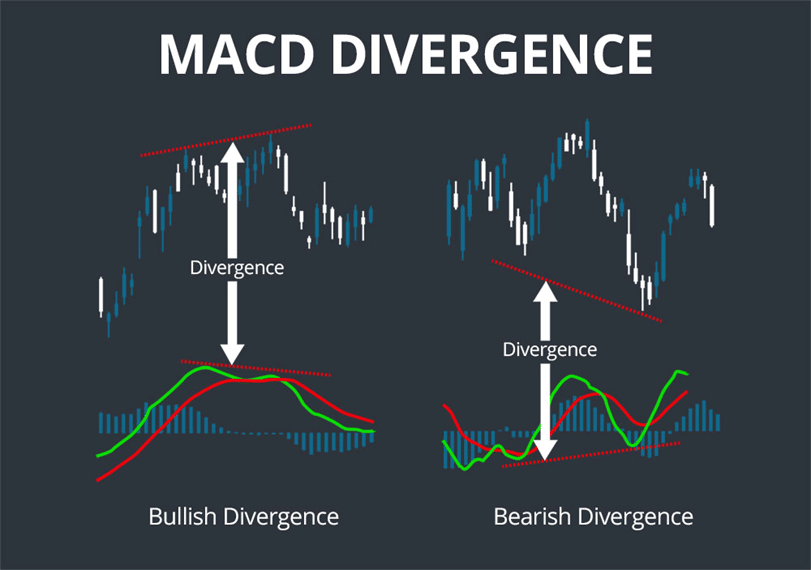
Regular divergence occurs when the price trend and the MACD indicator trend move in opposite directions. For instance, if the price is making higher highs, but the MACD is making lower highs, it suggests a potential reversal. Regular divergence serves as a warning sign for traders to be cautious about the current trend’s sustainability.
 2. Hidden Divergence:
Hidden divergence happens when the price trend and the MACD trend move in the same direction but at different paces. In a bullish hidden divergence, the price makes a higher low, while the MACD makes a lower low, indicating a potential continuation of the upward trend. Conversely, in a bearish hidden divergence, the price makes a lower high, while the MACD makes a higher high, signaling a potential continuation of the downward trend.
 3. Exaggerated Divergence:
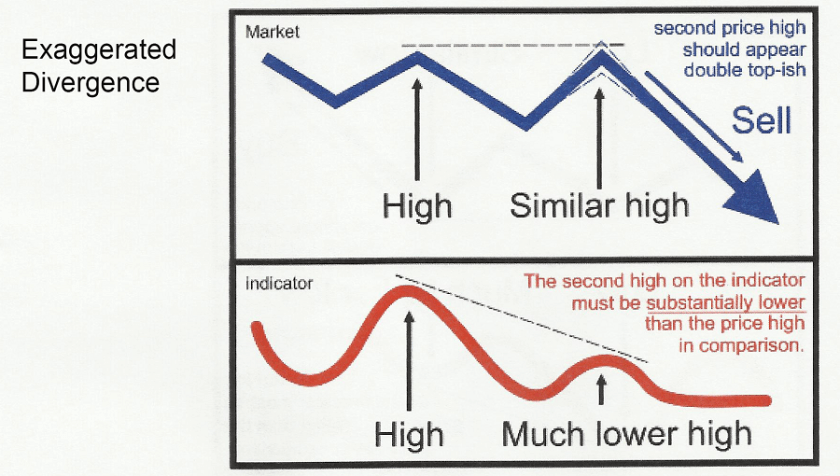
Exaggerated divergence emphasizes extreme price movements. It occurs when the price makes a significant move, but the MACD fails to confirm the trend with a proportional movement. Traders often interpret exaggerated divergence as a potential warning sign that a trend reversal may be imminent.
MACD in Conjunction with Elliott Wave Theory:
When combined with Elliott Wave Theory, MACD provides a comprehensive toolset for technical analysis. Elliott Wave identifies repetitive wave patterns in financial markets, and traders can use MACD to confirm potential reversal points within these waves.
Benefits for Beginners:
For beginners, the MACD indicator is user-friendly and provides a straightforward way to analyze trends and make informed trading decisions. Its visual representation simplifies the process of identifying potential entry and exit points, making it an accessible tool for traders with varying levels of experience.
Conclusion:
In conclusion, the MACD indicator stands as a versatile and effective tool for traders seeking to enhance their technical analysis. Understanding its components, interpreting divergence types (regular, hidden, and exaggerated), and incorporating it into broader frameworks like Elliott Wave Theory can significantly improve a trader’s ability to navigate the complexities of the financial markets. For beginners, the MACD indicator is a valuable ally, providing insights into market trends and helping them make more informed trading decisions.
Add a Comment
You must be logged in to post a comment