Gold Technical Analysis | Elliott Wave
By Rana Das, CEO of Forex Wave Expert
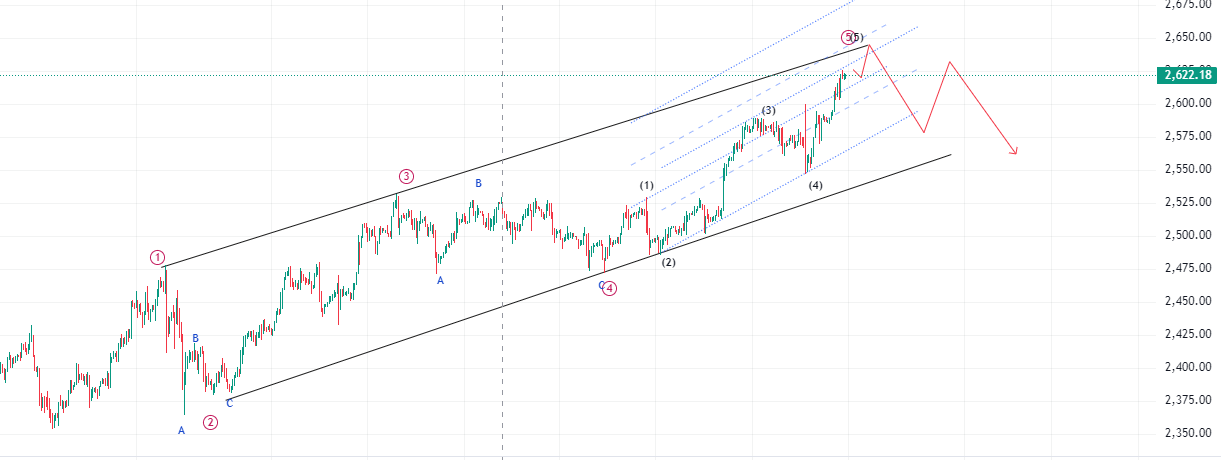
Gold Technical Analysis: Gold Price is at its highest price ever, and the price keeps going up day by day. Recently, we’ve seen many forex traders taking sell trades on gold repeatedly and losing their account balance. Today, I’ll try to give an Elliott Wave analysis on Gold (XAU/USD), using daily, hourly, and minute charts to explain the impulse wave.
Gold Forecast and Elliott wave analysis on Daily, Weekly chart basis.
Gold is currently showing a Wave 5 extension on the higher time frames like the weekly or daily chart. Right now, it seems to be forming Sub wave 3 of Wave 5. We can expect this rally to correct slightly before extending upward to around $2800-$3000. However, it’s important to watch the $2700-$2780 zone. If Sub wave 3 forms here, the price might correct down to $2500-$2550 before rising again. Even if a correction happens from the current price, a major correction doesn’t seem likely at this point.

Gold Forecast and Elliott wave analysis on H4,H2,H1 chart basis
On the hourly time frame, the internal impulse is still active. If the price corrects by another 300-500 pips, it could become even stronger, moving up by 1000-1500 pips. However, there’s a chance the price may go up another 300-400 pips before facing rejection. If that happens, the price could drop 1000-1500 pips on the hourly chart, making a strong move in the direction of the main impulse to complete Wave 5.


Add a Comment
You must be logged in to post a comment