

Gold analysis today starts with one fact: XAUUSD has given back yesterday’s bounce and sits near $3,996, the same area FWE marked as the base break entry on 26 October. The FWE M15 chart now shows two supply zones above price and a projected dip below $3,960 before any rebound. With the Fed decision due on Wednesday, this is a week to keep position size small.
Gold Today at a Glance
- Gold price: $3,996.00, down $20.20 (-0.50%) on the Kitco spot quote at 14:11 GMT+6, with a day range of $3,995.70 to $4,026.30. The FWE OANDA M15 chart showed $3,997.64 at 15:05 GMT+6.
- Main news: The Fed decision on Wednesday 28 October. A hold is priced at about 89.5%, and a December hike at about 82.3% (CME FedWatch, as reported on 27 October). Oil and US-Iran headlines still matter.
- FWE bias: Cautious. The FWE chart projects a dip below $3,960.45 first, then a rebound toward the M15 supply zones. The bigger swing view stays bearish below the $4,070 to $4,100 area.
- Key support: $3,960.45 (FWE chart), then $3,941.76.
- Key resistance: about $4,024 to $4,033, then about $4,074 to $4,091 (FWE chart zones).
FWE Gold Analysis Today: XAUUSD M15 Supply Zones
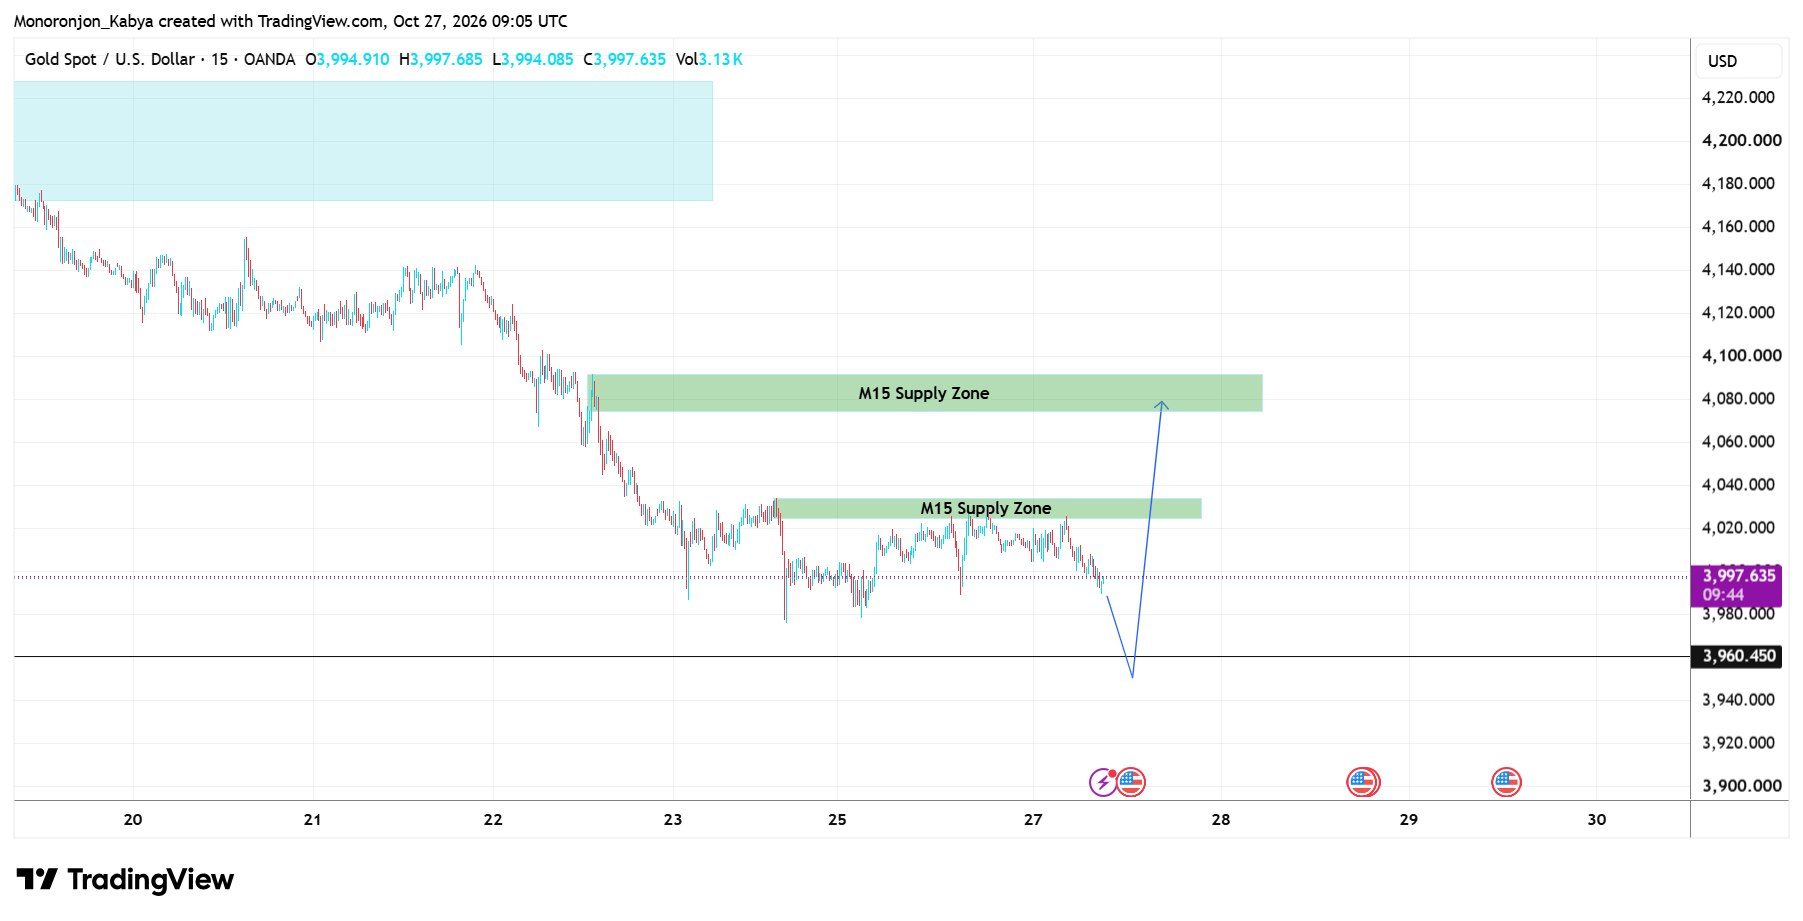
The chart is Gold Spot against the US dollar on the 15-minute timeframe (OANDA feed), created on 27 October 2026 at 09:05 UTC, which is 15:05 GMT+6. The last candle opened at $3,994.91, reached a high of $3,997.685 and a low of $3,994.085, and closed at $3,997.635. The chart runs from about 19 October to 30 October on the time axis.
Here is what the FWE chart marks:
- The fall. Price slid from about $4,180 on the left edge to the $3,990 area, with a sideways range between 24 and 26 October.
- Lower M15 supply zone. A green box labelled “M15 Supply Zone” sits at roughly $4,024 to $4,033, starting around 24 October. A supply zone is an area where sellers took control before, so price may stall or reverse there again.
- Upper M15 supply zone. A second green box, also labelled “M15 Supply Zone”, sits at roughly $4,074 to $4,091. It starts at the sharp drop around 22 to 23 October.
- Black line at $3,960.45. It has no label on the screenshot. The blue arrow goes through it, so we read it as the level the dip is expected to test.
- Blue arrow. It runs down to roughly $3,950, then sharply up into the upper supply zone. It is a projected path, not a prediction that must happen.
The zone prices above are read from the price axis, so treat them as close estimates, not exact figures. A pale blue box at the top left (about $4,172 to $4,227) has no label, so we do not use it in this update.
In simple terms, the FWE view is a two-step idea: a possible sweep lower below $3,960.45, then a rebound. From $3,997.64, the black line is about $37.19 away (around 372 pips, with 1 pip = $0.10 on gold). The lower supply zone starts about $26 above price, and the upper zone about $76 above. Those distances show why a rebound trade needs patience. Price must cross the first zone before it reaches the second.
Gold Price Today and Key News
Kitco’s spot quote was $3,996.00 at 14:11 GMT+6 on 27 October, down 0.50% on the day. Friday’s low was about $3,975, and last week was gold’s steepest weekly fall in more than four months, according to market reports. Gold then rebounded above $4,000 on Monday as oil eased.
Yesterday’s FWE long idea had a target at $4,033.22. Kitco’s high on 26 October was $4,030.60 and today’s high so far is $4,026.30, so that target was not reached on that feed. Price has since returned to the entry area at $3,996.76.
What Is Driving Gold Today
News and oil. Oil fell about 2% on Monday as diplomacy over the Strait of Hormuz cooled worries, with Brent near $114 and WTI above $100. There is still no confirmed settlement between Washington and Tehran. Market reports this morning link gold’s weakness to a dollar recovery and Middle East concerns. That is their reading, and the exact cause of today’s move is not certain.
Fed expectations. The Fed raised rates in September to 3.75% to 4.00% and is expected to hold on Wednesday. CME FedWatch pricing, as reported on 27 October, shows about 89.5% for a hold and about 82.3% for a December hike. Yesterday’s FWE post quoted 90.6% and 79.7%, so December hike odds have edged up. A hold may bring little relief to gold if the Fed keeps the door open for December.
Dollar and yields. The US Dollar Index closed at 101.63 on 26 October, down 0.04%, in Investing.com’s daily table. A market report on the morning of 27 October put it marginally above 102.00 after two days of gains. Feeds differ, so check your own platform. The US 10-year Treasury yield was around 4.98% to 4.99% on 26 October. A yield near 5% is a headwind for gold, which pays no interest. Still, oil, geopolitics and Fed pricing all push at the same time, so do not credit the dollar for every move.
Gold Forecast Today and Gold Price Forecast This Week
Everything here is probability, not a promise.
FWE chart scenario. Price dips below $3,960.45, finds buyers, and rebounds through $4,024 to $4,033 toward $4,074 to $4,091. That upper zone sits inside the $4,070 to $4,100 area that FWE’s earlier swing view marked as a place where sellers may return. The scenario is invalidated if price keeps falling after the dip. A sustained M15 close below $3,941.76 (the June 30 low, our own reference, not an FWE chart level) would end the rebound idea.
Bearish scenario. Price loses $3,960 and then $3,941.76. Market reports then point to $3,890 and $3,800. FWE’s 23 October view keeps the larger channel target near $3,750 to $3,800.
Additional market context. Beyond the levels on the FWE chart, the daily chart still leans bearish. A market report on 27 October put gold below its 9-day moving average near $4,067, with the daily RSI (a momentum gauge) at about 35, close to oversold but not there. This does not contradict the FWE chart. A short-term M15 rebound can happen inside a larger downtrend, and rebounds into $4,020 to $4,070 are where that trend may resume.
Gold Support and Resistance Today: Key Levels
| Level | Price | Source | Why it matters |
|---|---|---|---|
| Upper M15 supply zone | About $4,074 to $4,091 | FWE chart | Target area of the projected rebound |
| Lower M15 supply zone | About $4,024 to $4,033 | FWE chart, market data | First hurdle, near yesterday’s $4,033.22 target |
| Base break entry | $3,996.76 | FWE chart (26 October) | Price is sitting on it now |
| Previous stop level | $3,978.54 | FWE chart (26 October) | Break confirms weakness |
| Black line | $3,960.45 | FWE chart | Projected dip level, label unclear |
| June 30 low | $3,941.76 | Market data | Key support, loss opens $3,890 and $3,800 |
What Changed Since the 26 October Analysis
In our 26 October gold chart analysis, the M15 long idea aimed at $4,033.22 with a stop under $3,978.54. Price rose to about $4,025 on the chart, did not reach the target, and has fallen back to the entry. The idea has not failed on the chart levels, but it gave back the whole bounce. Anyone holding it is near break even, with the Fed decision still ahead.
What is new is the FWE team’s view that a dip below $3,960.45 may come before the rebound. The $4,070 to $4,100 zone from our 23 October XAUUSD analysis still matters as the main swing resistance.
What to Watch Next (Bangladesh Time)
- Today, 18:30 GMT+6: US durable goods for September, a minor release (consensus 1.5%).
- Wednesday 28 October, 00:00 on 29 October GMT+6: Fed decision at 2:00 pm New York time, then the press conference. Our guide on how to trade gold during FOMC covers spreads and slippage on such nights.
- Thursday 29 October, 18:30 GMT+6: US third-quarter GDP (consensus 3.2%) and September PCE inflation (consensus 3.6%). A hot PCE can lift December hike odds.
Traders in Bangladesh should note that the Fed statement lands at midnight local time. Many spreads widen then, and price can jump past a stop.
Worked example: position size in Fed week (hypothetical)
Say you have a $5,000 account and risk 1%, which is $50. You buy near $3,997.60 with a stop at $3,940.00, just under the June low. The stop is $57.60 away, about 576 pips. One standard lot is 100 ounces, so 0.01 lot is one ounce and loses $57.60 at the stop. That is 1.15% of the account, even at the smallest size most brokers offer. A stop this wide is hard to justify at 1% risk, so many traders will skip it or wait for a closer entry. Real results change with spreads, fees and slippage. Our lot size guide shows the full steps.
Follow daily gold and forex updates on the FWE Telegram channel.
Frequently Asked Questions
Is gold going up today?
At 14:11 GMT+6 gold was down 0.50% at $3,996.00. The FWE M15 chart allows for a dip below $3,960.45 before a rebound, and daily indicators still lean bearish. The Fed decision could swing price either way.
What is the gold forecast for this week?
The main event is the Fed decision on Wednesday, with a hold widely priced. Thursday’s GDP and PCE data can move December hike odds. Gold stays bearish below $4,070 to $4,100 and weaker below $3,941.76.
What are the key gold levels today?
Support sits at $3,960.45 (FWE chart) and $3,941.76. Resistance sits at about $4,024 to $4,033 and about $4,074 to $4,091. The $3,996.76 entry level from yesterday is the pivot price is testing now.
What is a supply zone on the gold chart?
A supply zone is a price area where sellers took control before. When price returns there, sellers may act again, so traders watch it for a stall or a reversal. It is a probability, not a guarantee.
This analysis is an opinion about probabilities, not a signal or financial advice. Gold can move several dollars in seconds around Fed news, and you can lose money. Never risk more than you can afford to lose.
Editorial Note: The charts and technical analysis in this post are prepared by the ForexWaveExpert (FWE) trading team. Every post is reviewed, fact-checked and corrected by Rana Das, Founder & CEO of ForexWaveExpert, a gold trader with 15+ years of experience in Elliott Wave and Price Action and winner of the Fastbull Best Mentor Award 2024. This analysis is for educational purposes only and is not financial advice.