# Understanding Zigzag Patterns in Elliott Wave Theory
Financial markets exhibit a fascinating interplay of trends and corrections, providing traders and analysts with valuable insights for making informed decisions. One such analytical framework is Elliott Wave Theory, where corrective patterns play a crucial role in deciphering the complexities of market movements. In this exploration, we delve into the intricate world of Single Zigzag, Double Zigzag, and Triple Zigzag patterns, unraveling their structures and applications. #zigzag patterns
 ## Single Zigzag
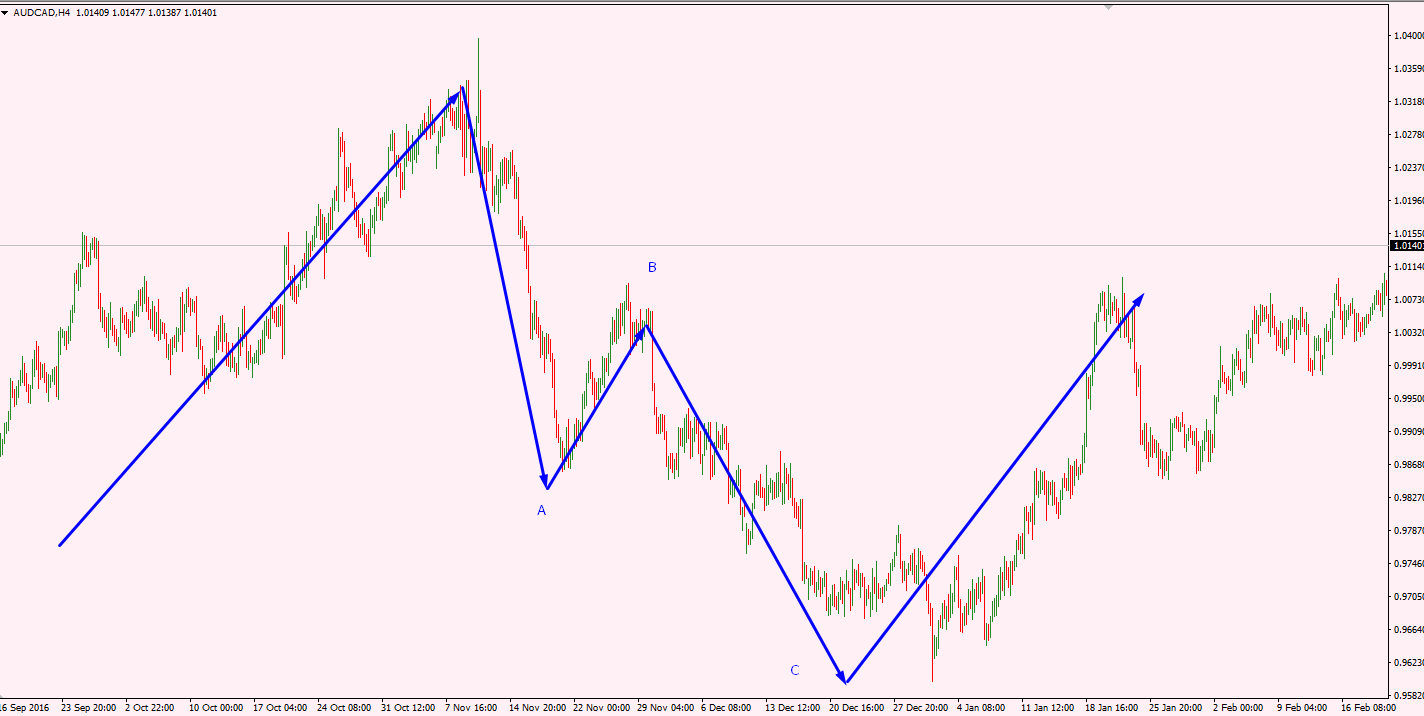
– A zigzag or downtrend market moves against the major trend.
– In a zigzag correction, it sharply moves in the opposite direction of the Wave A trend, Wave B makes a short correction, and Wave C continues to move rapidly in the opposite direction of the major wave.
– Internal structure of the zigzag pattern.
– In Wave A, it moves against the trend of the 5 major waves.
– In Wave B, it makes short movements towards the trend of 3 major waves.
– In Wave C, formed by 5 sub-waves, it moves in the opposite direction of the major trend.
– Zigzag patterns end with impulse, corrective, or impulse movements.
– Within zigzag, Wave A and C must be diagonal or impulsive, but either A or C can be diagonal.
– Within zigzag, Wave B can be any corrective pattern, such as zigzag, flat, triangle, or any combined pattern.
– Zigzag is primarily formed in Wave 2 and ends by moving towards Wave 3.
– Wave B will never cross Wave A.
– Wave B retraces up to 38-61% of Wave A.
– Wave C equals or exceeds Wave A, and if it exceeds 100%, it becomes a Fibonacci expansion of 161%.
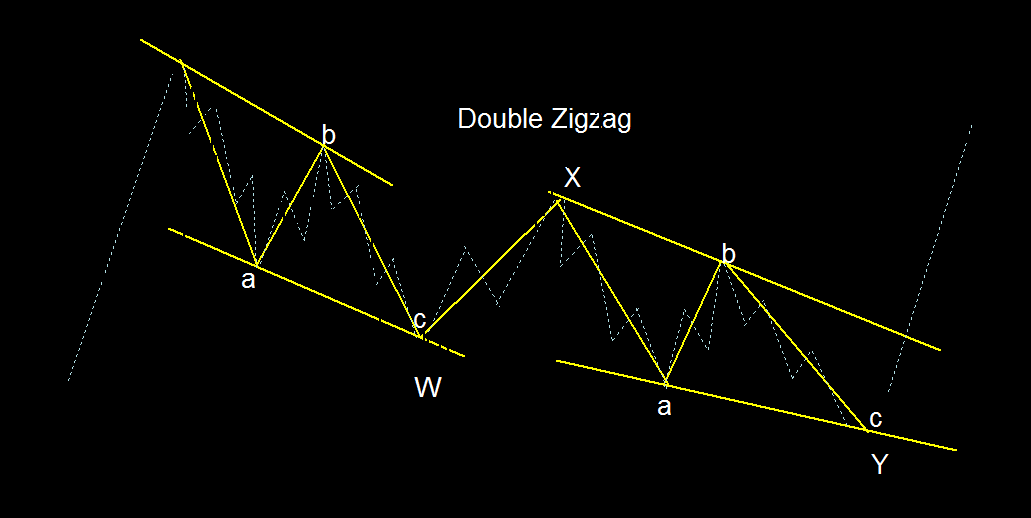
## Double Zigzag
– Connection of two Zigzag patterns.
– A sharp movement against the major trend. Double Zigzag is calculated as W-X-Y legs, where W and Y are Zigzags, and Y combines two Zigzags.

### Double Zigzag Pattern in Elliott Wave Theory
1. **Definition:**
– A double zigzag is an Elliott Wave pattern that primarily consists of two zigzag sub-patterns connected together.
– It occurs as a corrective pattern (A-B-C) within a larger trend.
– The sub-patterns follow a 5-3-5 sequence.
2. **Structure:**
– In a bull market, a double zigzag forms when two simple three-wave sub-patterns (A-B-C) are connected.
– The sub-patterns follow a 5-3-5 sequence, and the B leg starts well below the peak of the A leg.
– In a bear market, a double zigzag forms by connecting two simple three-wave sub-patterns (A-B-C).
– The sub-patterns follow a 5-3-5 sequence, and the B leg starts well below the peak of the A leg.
– These patterns resemble an extended impulse wave but are less common.
3. **Fibonacci Application:**
– Before applying Fibonacci ratios, it’s helpful to identify the internal sub-waves of the zigzags.
– Fibonacci retracement levels for the B leg are typically between 50% and 61% of the A leg.
– For most C legs, Fibonacci expansion from 0 to A and A to B ranges from 100% to 161%.
Remember that live market scenarios may vary, and it’s essential to adapt your analysis accordingly.
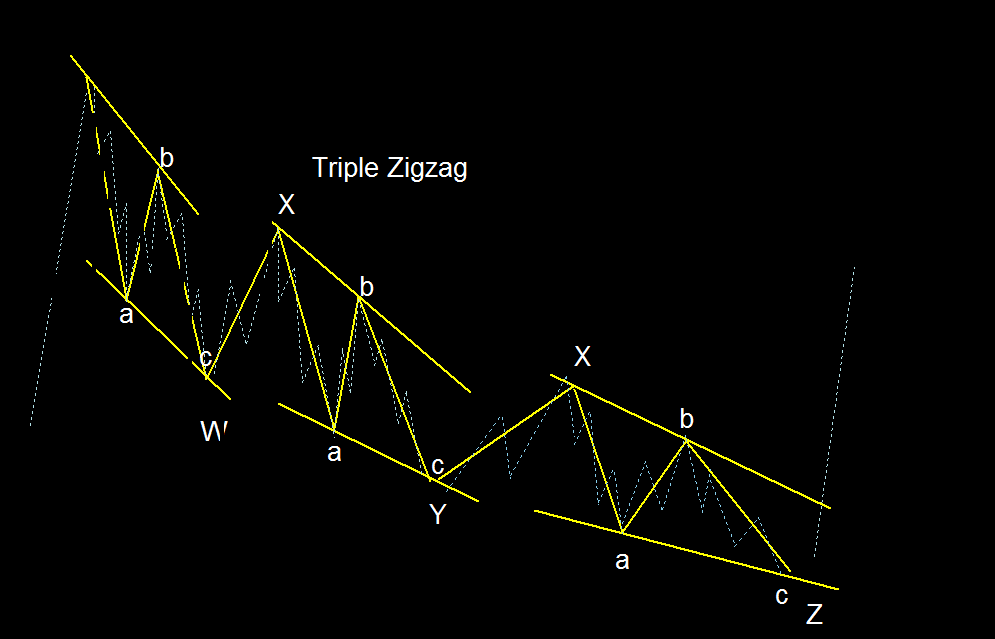
## Triple Zigzag
– Connection of three Zigzag patterns.
– A sharp movement against the major trend. Triple Zigzag is calculated as W-X-Y-X-Z legs, where W, Y, and Z are Zigzags, and X is used as a Zigzag connection.

### Triple Zigzag in Elliott Wave Theory
1. **Definition:**
– A triple zigzag is an advanced corrective pattern that combines three zigzag sub-patterns.
– It occurs as a sharp movement against the major trend.
– The sub-patterns follow a 5-3-5 sequence: W-X-Y-X-Z.
2. **Structure:**
– In a triple zigzag, the first zigzag (W) is rarely large enough to constitute an adequate price correction of the preceding wave.
– Doubling or tripling the initial form (W) is usually necessary to create an adequately sized price retracement.
– The sub-patterns (W, Y, and Z) are separated by intervening “three” waves, resulting in a triple zigzag.
3. **Fibonacci Application:**
– Traders can use Fibonacci ratios to identify potential price targets within triple zigzags.
– For retracement levels, consider:
– B leg: Optimal retracement is typically between 50% and 61% of the A leg.
– C legs: Fibonacci expansion from 0 to A and A to B ranges from 100% to 161%.
Remember that live market scenarios may vary, and it’s essential to adapt your analysis based on actual price movements.
## Example with Image: How to Use Fibonacci
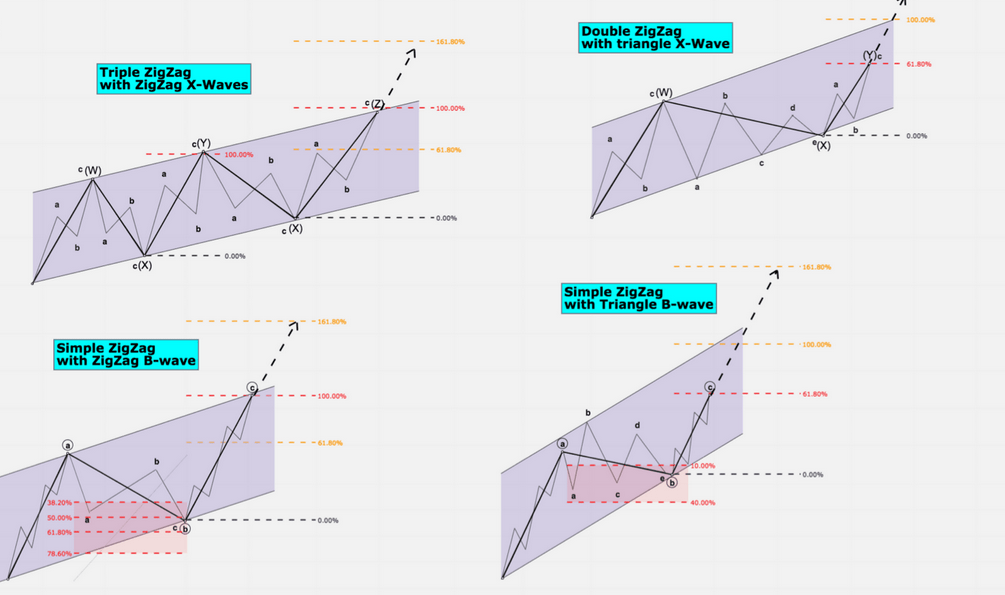
In the picture below, you can see a practical application demonstrating how to use Fibonacci in analyzing a Zigzag pattern. Please note that real-time markets may present varying complexities, and this example provides a simplified explanation.

1. **Finding the B Leg:**
– Look for a retracement of 50-61% of the A leg. This retracement level helps identify potential turning points in the corrective pattern.
2. **Analyzing the C Leg:**
– The C leg often extends from Wave 0 to A and A to B. Fibonacci expansion levels of 100-161% can be applied to anticipate the possible range of the C leg.
3. **Wave B Creating a Smaller Zigzag:**
– In certain situations, Wave B itself may form a smaller Zigzag pattern within the overall corrective structure.
4. **Zigzag with Triangle Formation:**
– If Wave B forms a triangle, the retracement for this specific pattern is typically within the range of 38-61%.
5. **C Leg Expansion Levels:**
– For the C leg (Wave 0-to-A), Fibonacci expansion levels of 61-161% are commonly observed. These levels provide insights into potential price extensions.
Refer to the image for a visual representation of a simple Zigzag with labels depicting different pattern formations.
Armed with this knowledge, traders can navigate the dynamic landscape of financial markets with more informed decision-making.
## Conclusion
In conclusion, the realm of corrective patterns, exemplified by Single Zigzag, Double Zigzag, and Triple Zigzag formations, serves as a crucial domain within Elliott Wave Theory. These patterns not only provide valuable insights into market dynamics but also equip traders and analysts with tools to make informed decisions.
Understanding the intricate structures and Fibonacci applications associated with Zigzag patterns opens doors to a nuanced perspective on potential price actions. It’s imperative, however, to bear in mind that actual market movements may not always perfectly align with depicted patterns. Therefore, these guidelines should be viewed as a valuable reference rather than rigid rules.
Armed with this knowledge, traders can confidently navigate the dynamic landscape of financial markets, employing a more informed and strategic approach. As market scenarios evolve, adapting analyses accordingly remains essential for successful decision-making. May your journey through the waves of market trends be prosperous and well-guided. #forexwaveexpert

 ## Single Zigzag
Add a Comment
You must be logged in to post a comment